
Context
Many sources, one search results page
When you search on a website, the results page is often filled from several outside sources, called providers: one supplies ads, another web links, others images or videos. Someone has to decide which source to ask first, what to do if it comes back empty, and how to split visitors between different setups. Put together, those decisions form a flowchart.
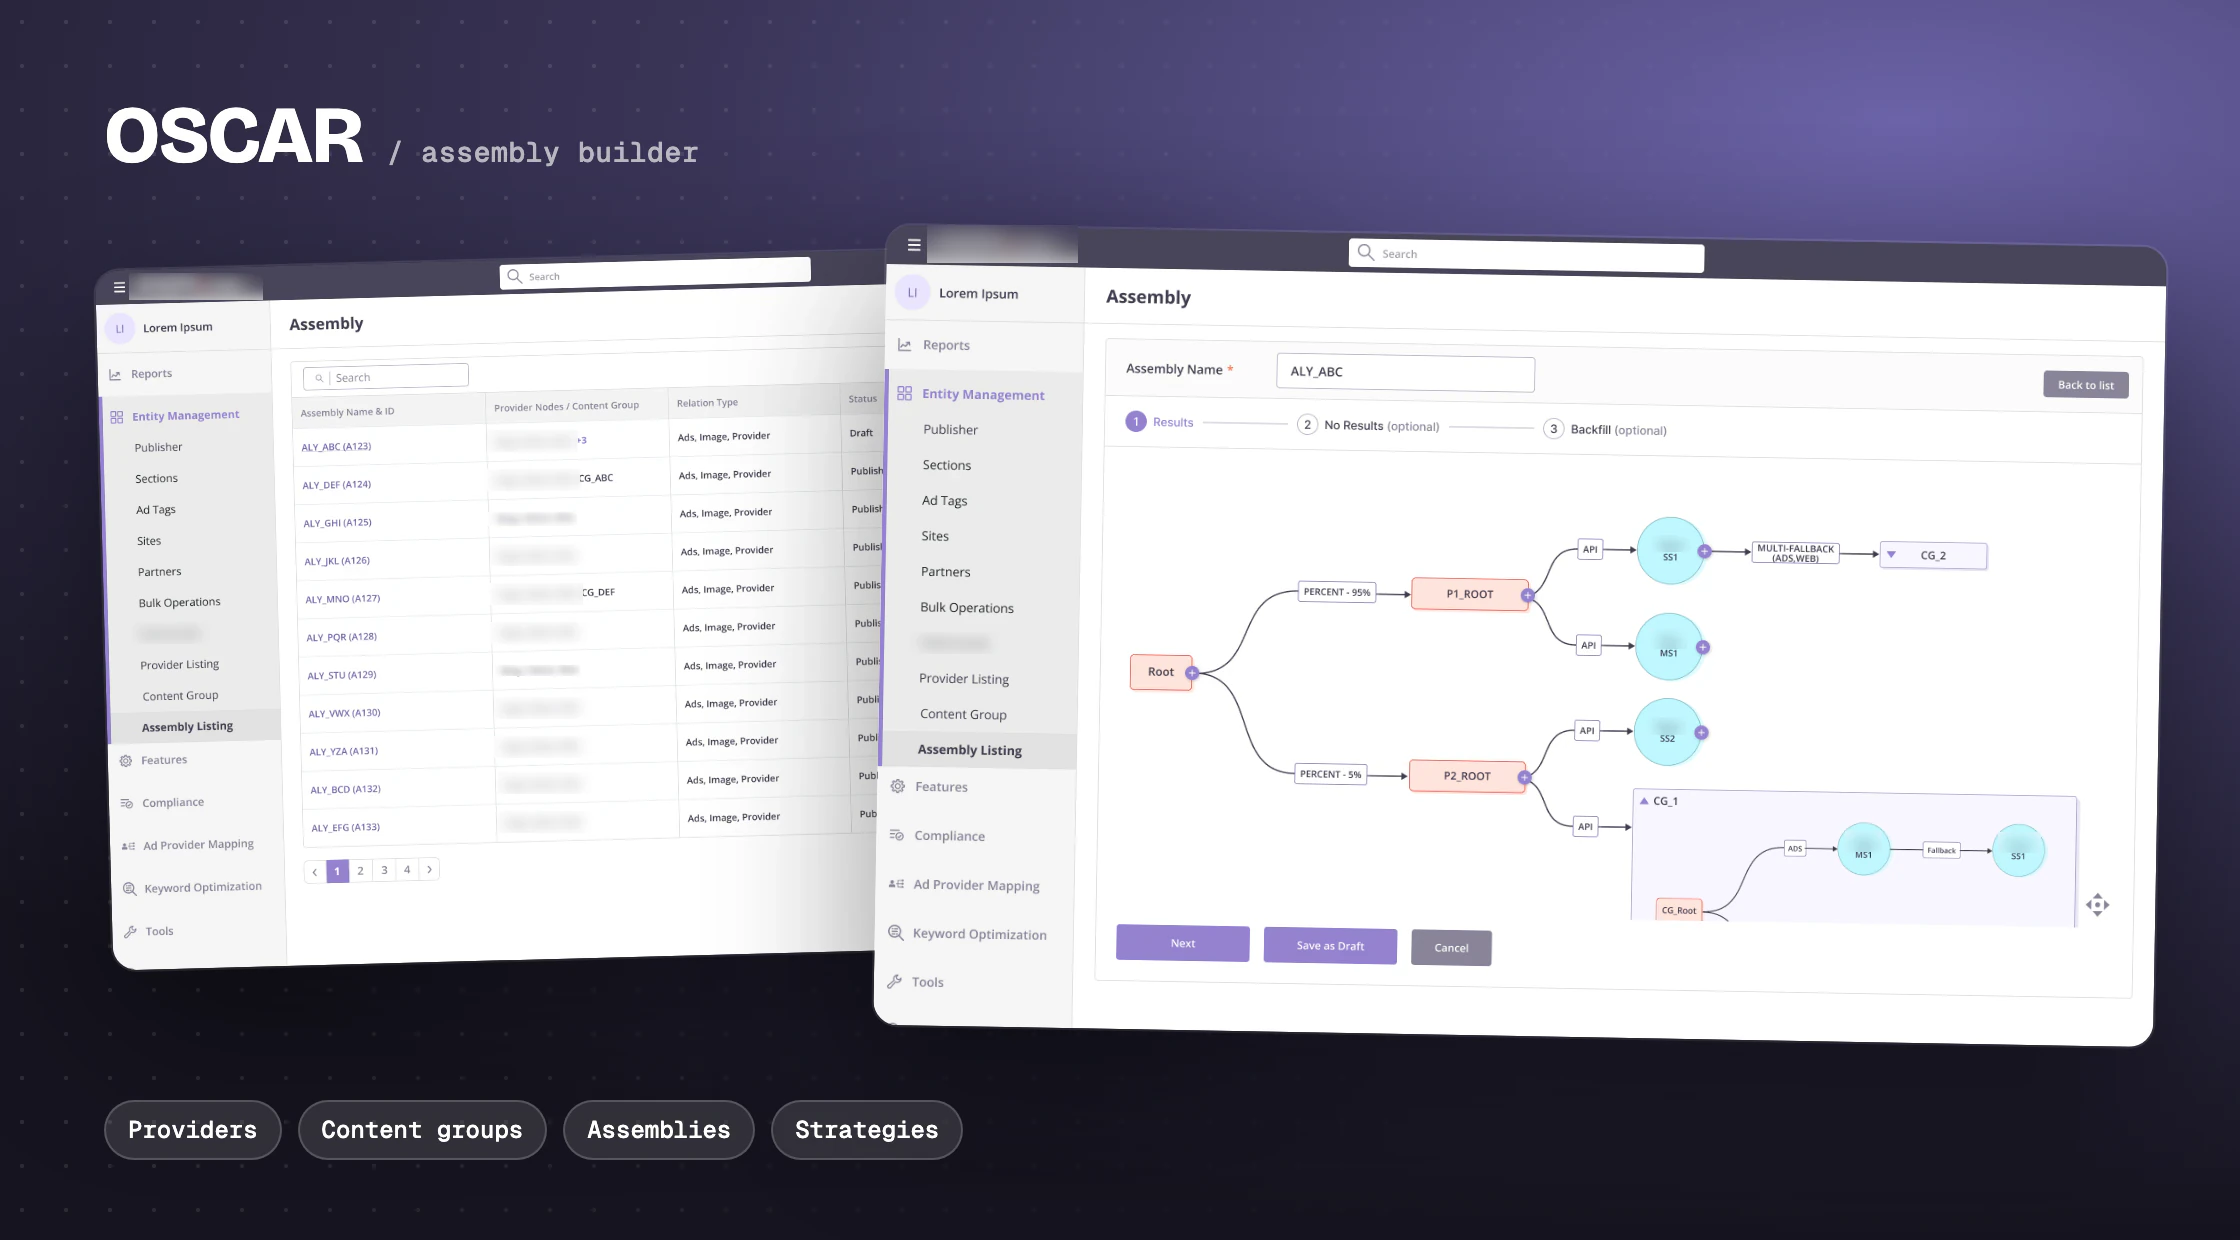
OSCAR is the tool inside Empire, Media.net’s internal platform, where teams draw that flowchart. I designed it from the first wireframes to the final screens: the list of providers, reusable chains, the flowchart builder, and later strategies and behaviours.
A source of results, like ads, web links, images or video. Engineers set providers up; this is where teams find them.
A saved chain of two or more providers, like "ask this source, and if it has nothing, ask that one". An admin publishes it before anyone can use it.
The whole flowchart for one results page: the main results, plus optional steps for when nothing comes back and for filling empty spots.
The arrow between two steps, saying how they connect: ask a source directly, try a backup, split visitors by percent, compare results, or follow a condition.
The problem
A powerful engine with strict rules
The engine behind it is flexible, and that is exactly what makes it hard to use. Not every kind of arrow can follow every step, and the product spec listed strict rules, for example:
- The very first step can only ask a source directly or split visitors by percent
- After a source or a saved chain, you can only add a backup, several backups or a comparison
- After a comparison’s decision, only conditions; after a condition, a split, a direct ask or an override
- A backup can only come after the first source in a chain, never at the very start
Get any of this wrong and a live page breaks. Asking people to memorise the rules was not an option.
Let someone build a working flowchart without having to memorise the rules behind it?
Principles
Four rules I designed by
Show the flowchart, not a form. Everything is drawn as steps and arrows, the same way the engine runs it.
Only offer what is valid. Each "+" offers only the arrows allowed from that step, and the next field appears only after you pick one.
Grow it from the start. The first step, called Root, is placed for you. Each move adds one arrow and one step, so you never face a blank canvas.
Reuse, don't repeat. Common chains become content groups that drop into any flowchart as a single step.
Providers
Start by knowing what you can use
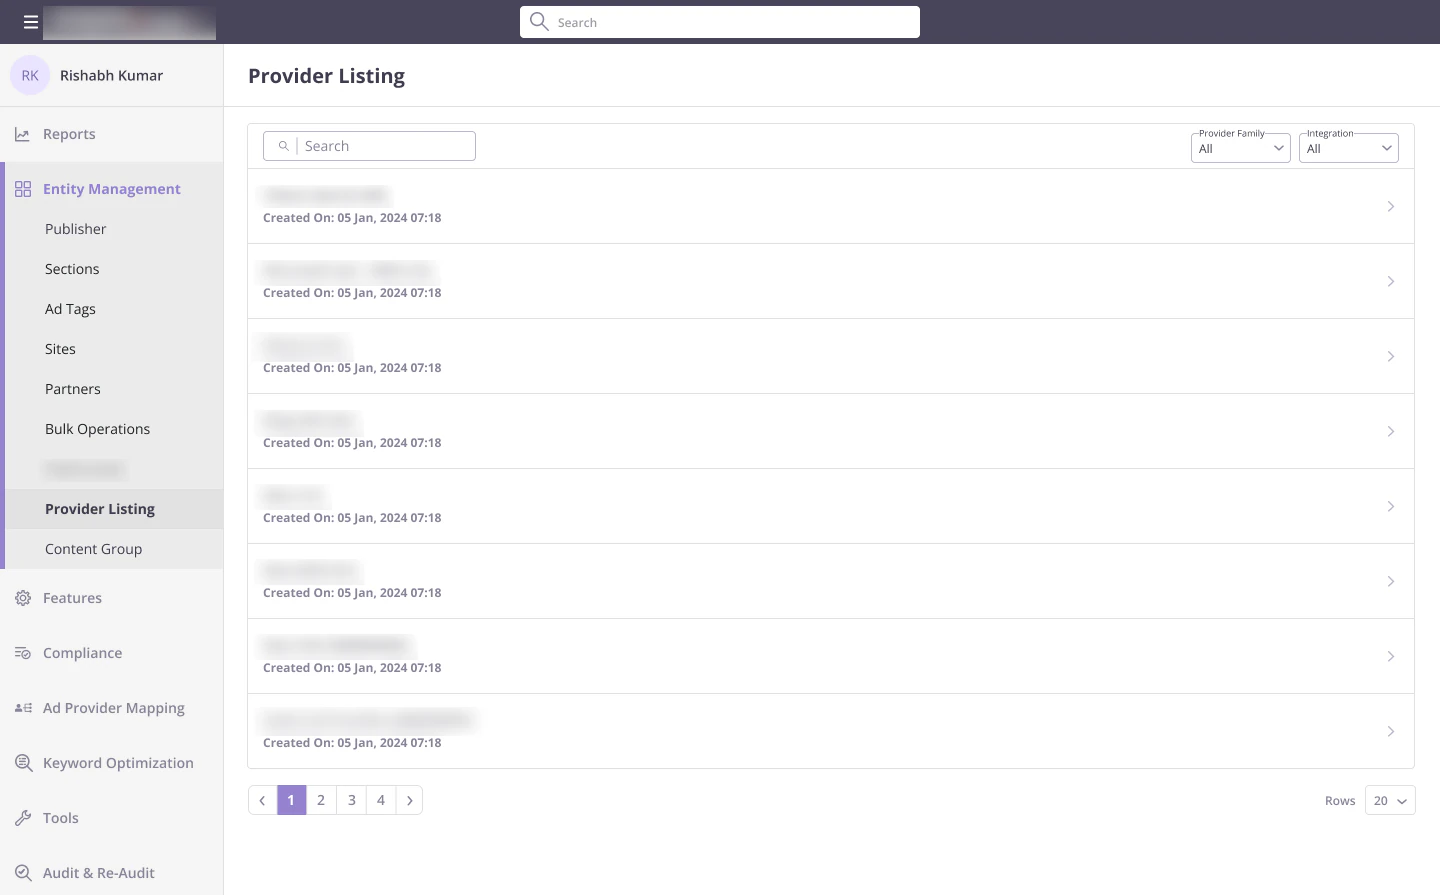
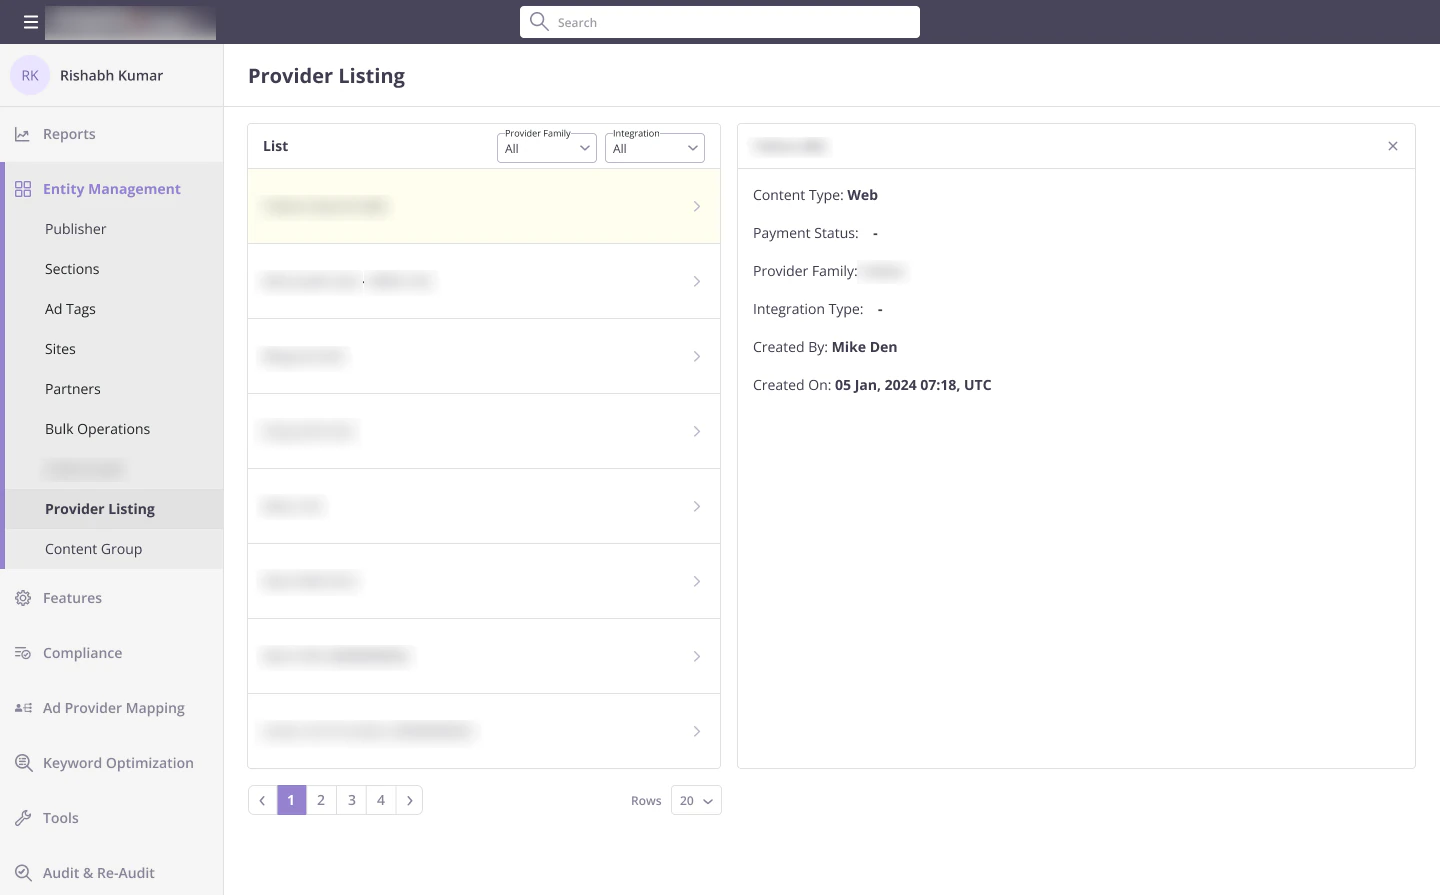
Engineers set providers up, so this list is for finding and understanding them. You can search by name or ID and filter by type. Picking a provider opens its details beside the list, so you never lose your place.
Content groups
Package a chain once, reuse it everywhere
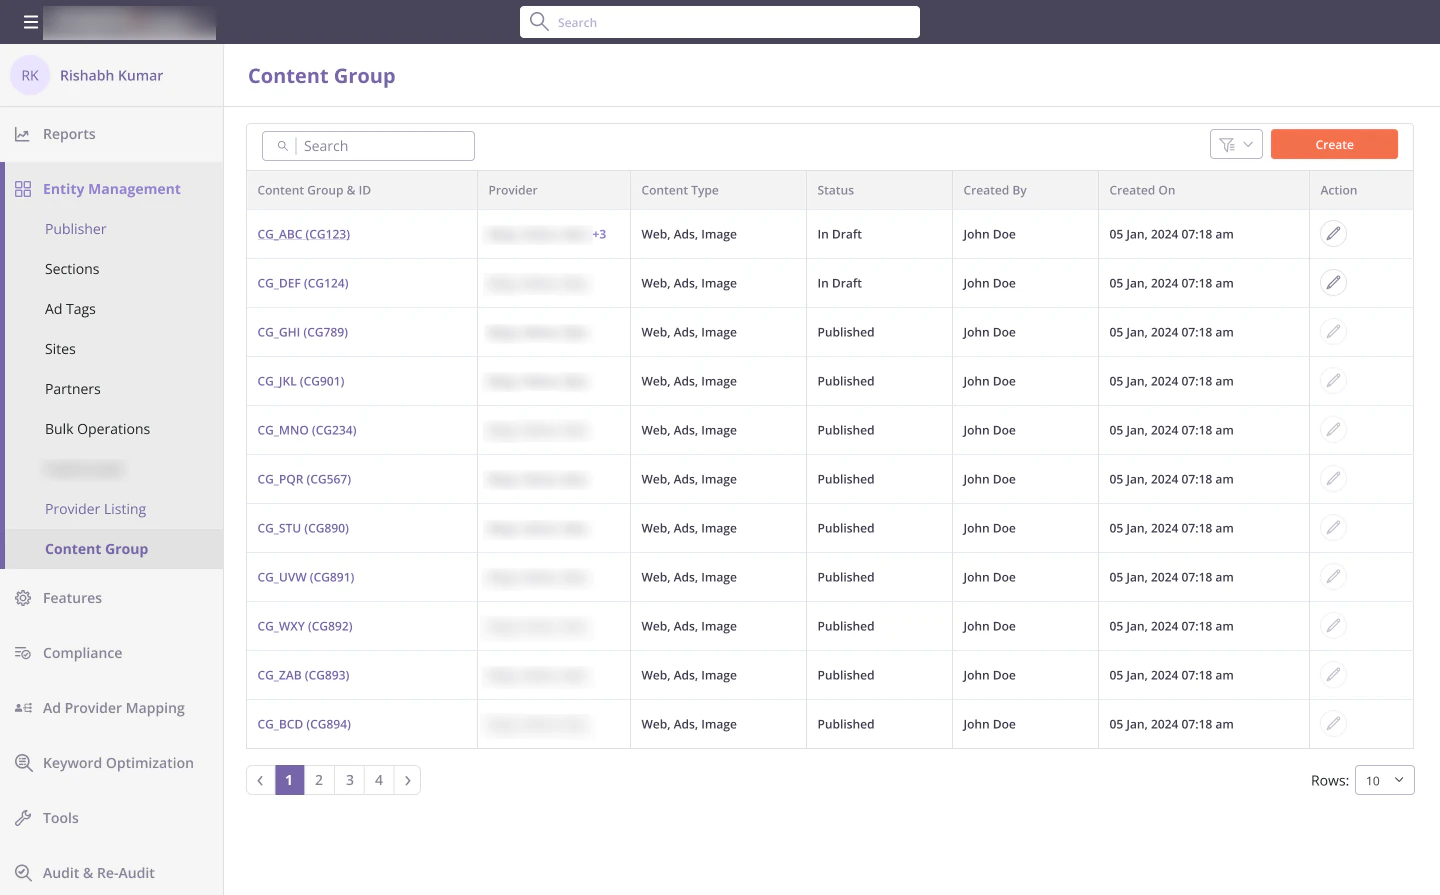
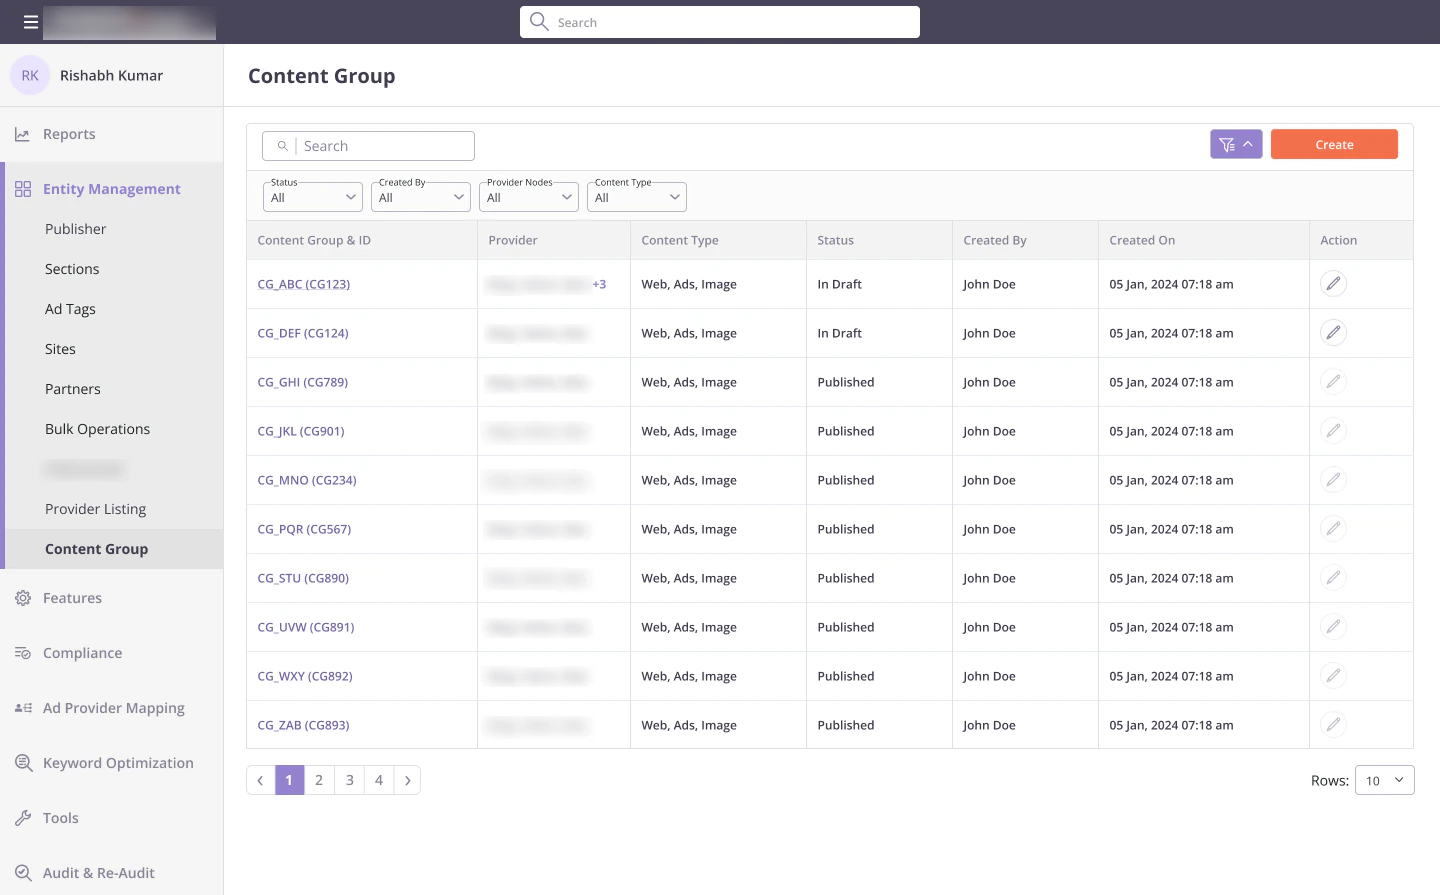
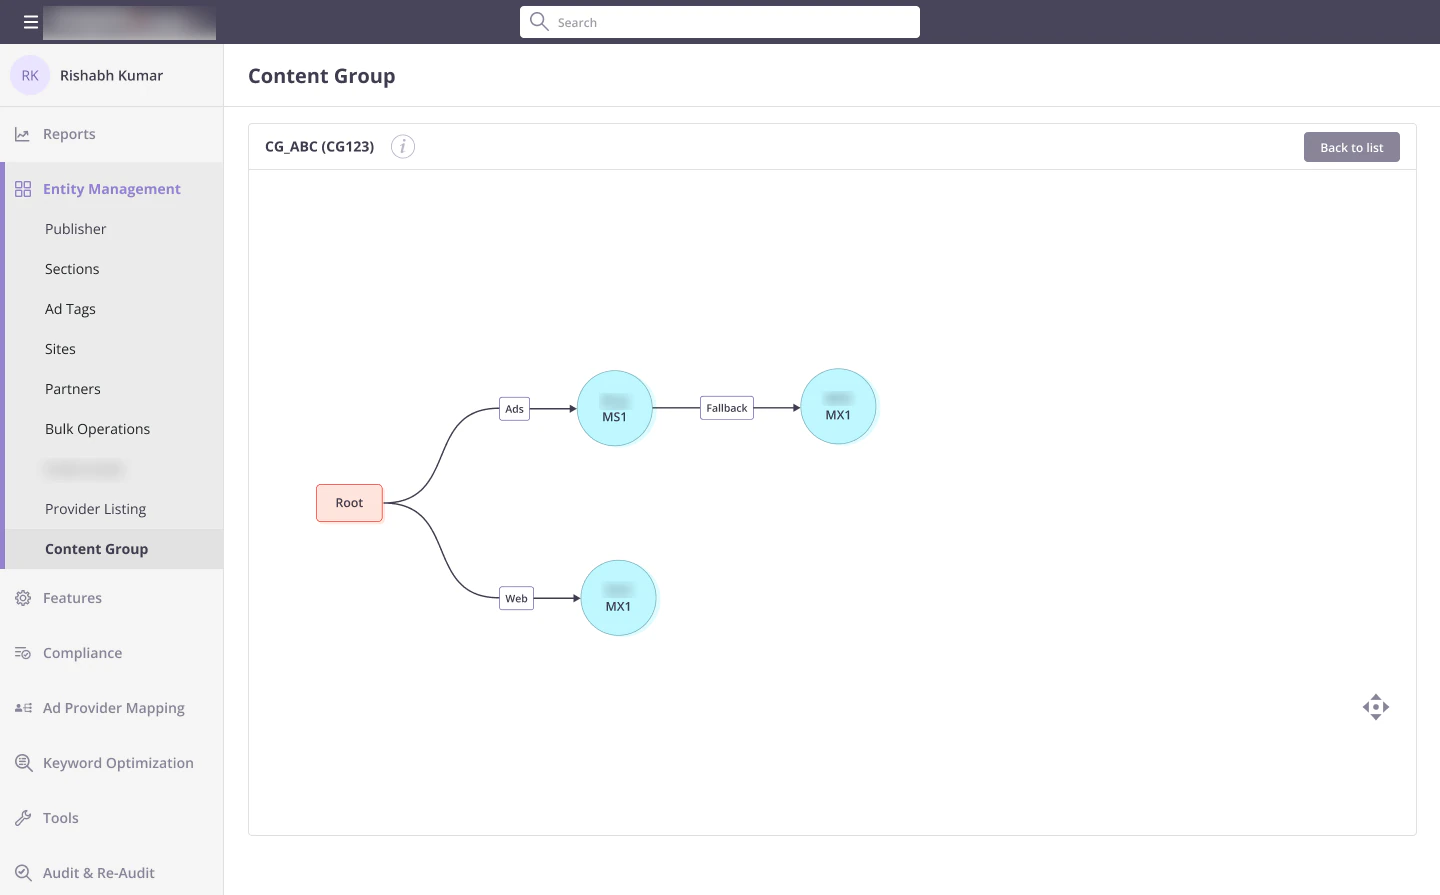
A content group is a small flowchart of two or more providers, such as one search provider with a backup provider behind it. The list shows every group with its providers, the kinds of content they return and their status, with filters for each.
Building one
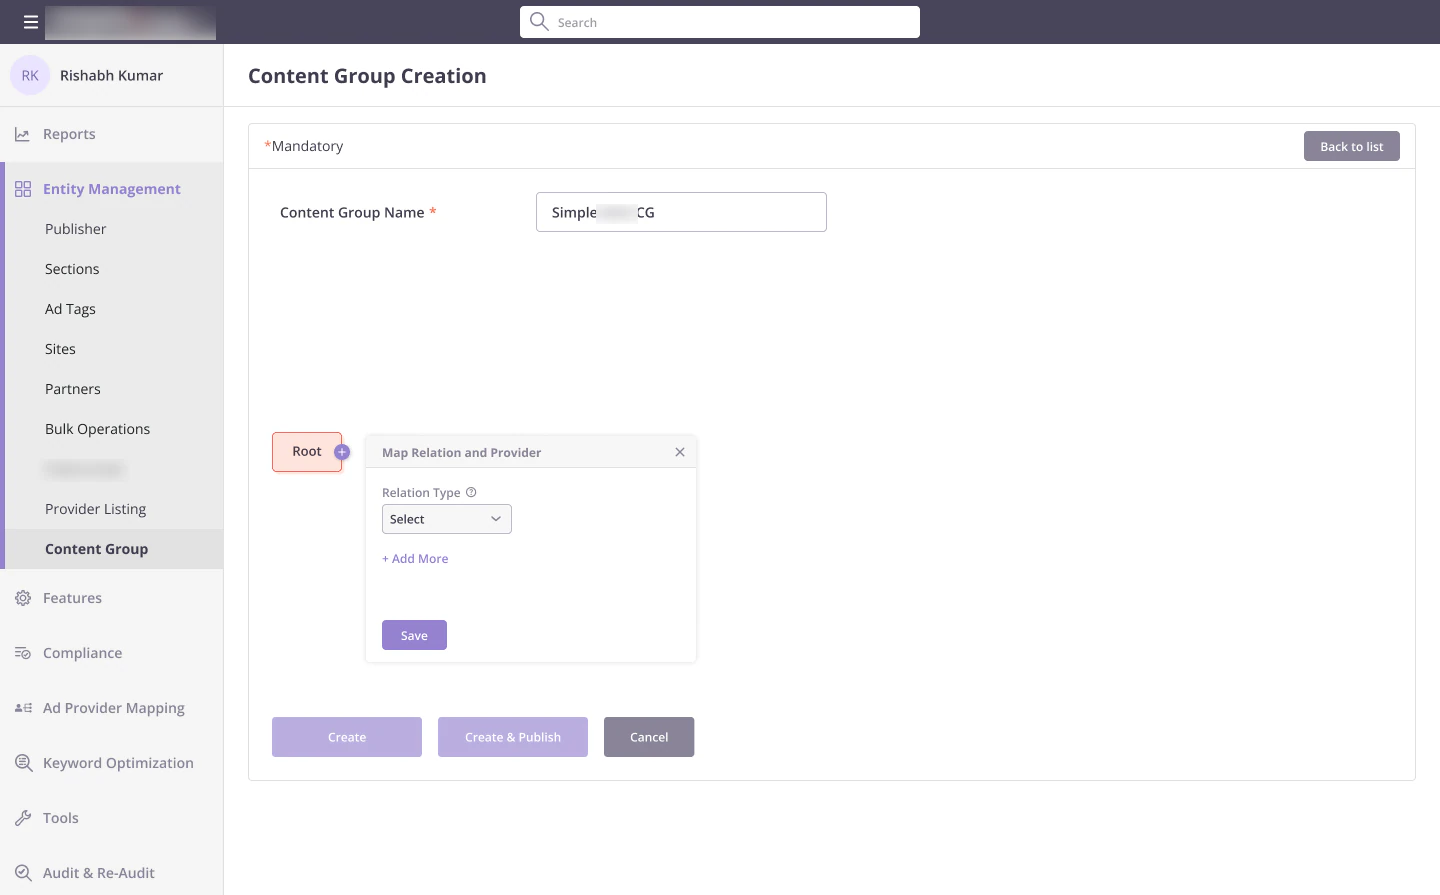
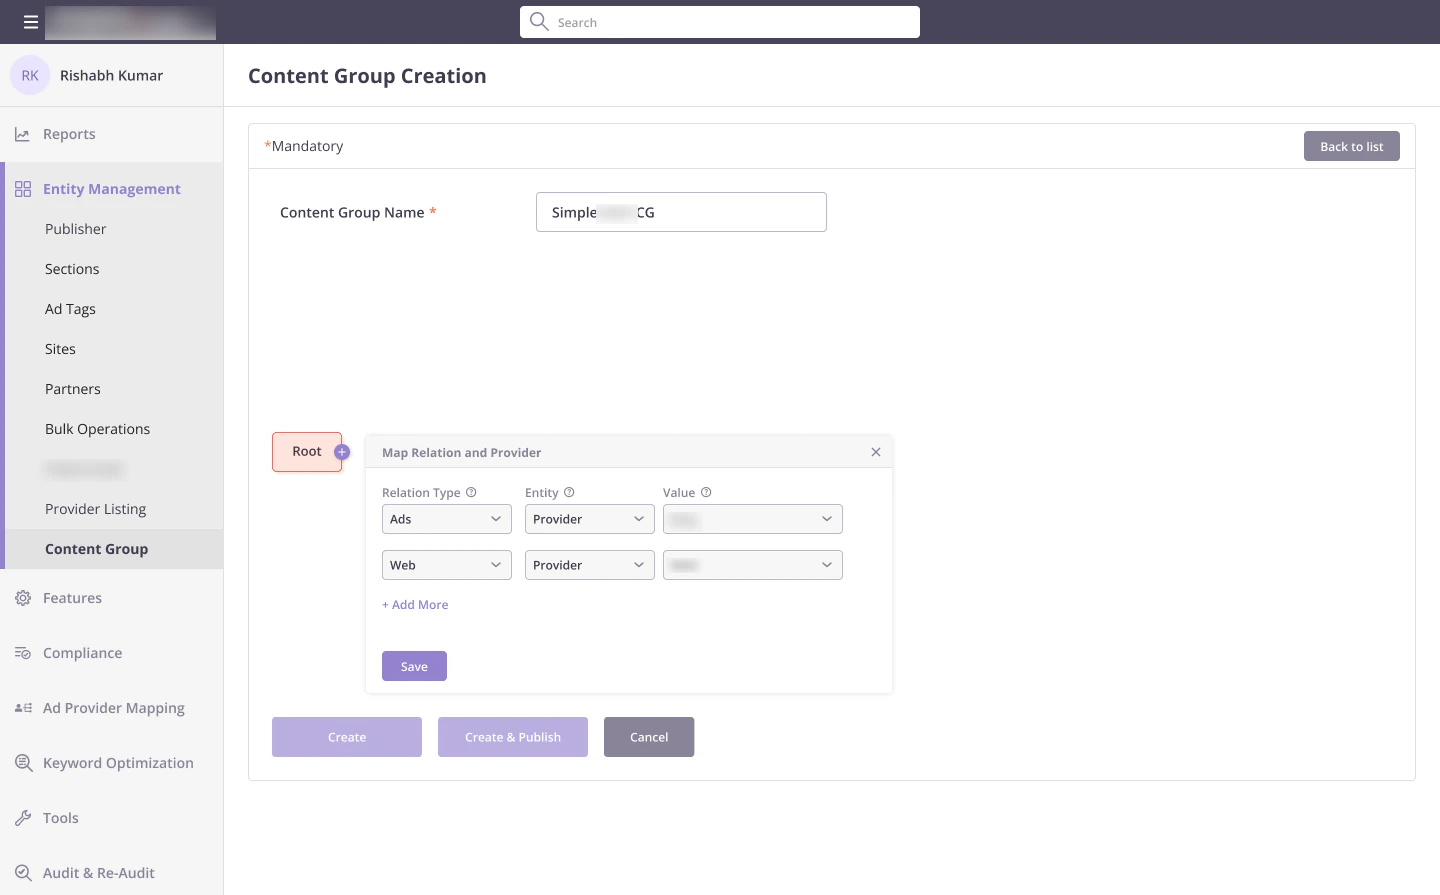
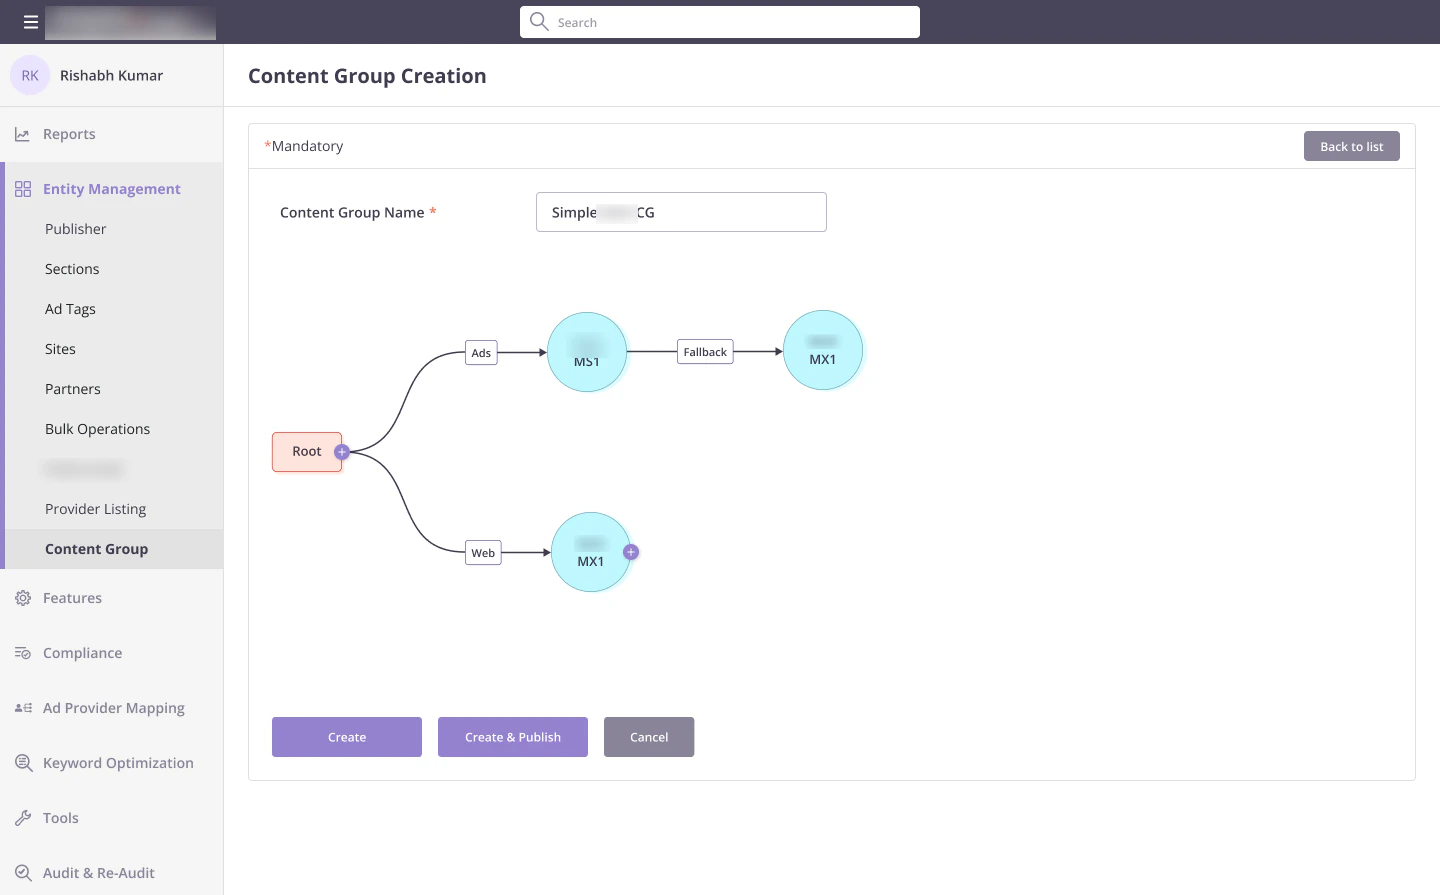
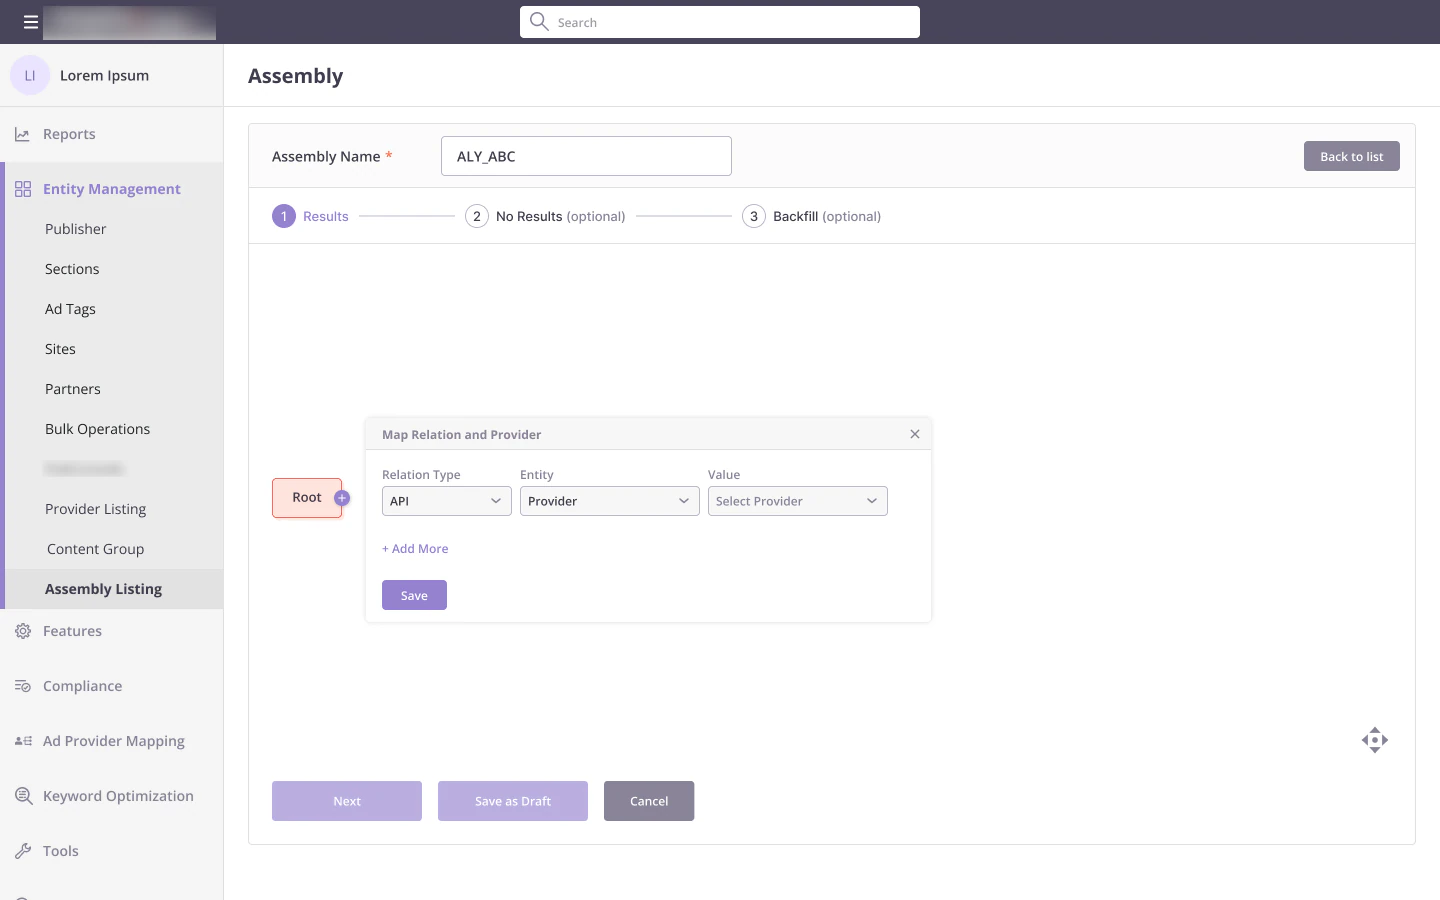
Creating a group starts with a name, and the first step is already in place. The "+" on a step opens Map Relation and Provider: pick the kind of arrow first, then the provider. Only valid options appear, and each field has a hint. Add as many arrows as you need, and add a backup once the chain has its first provider.
Publishing is a gate
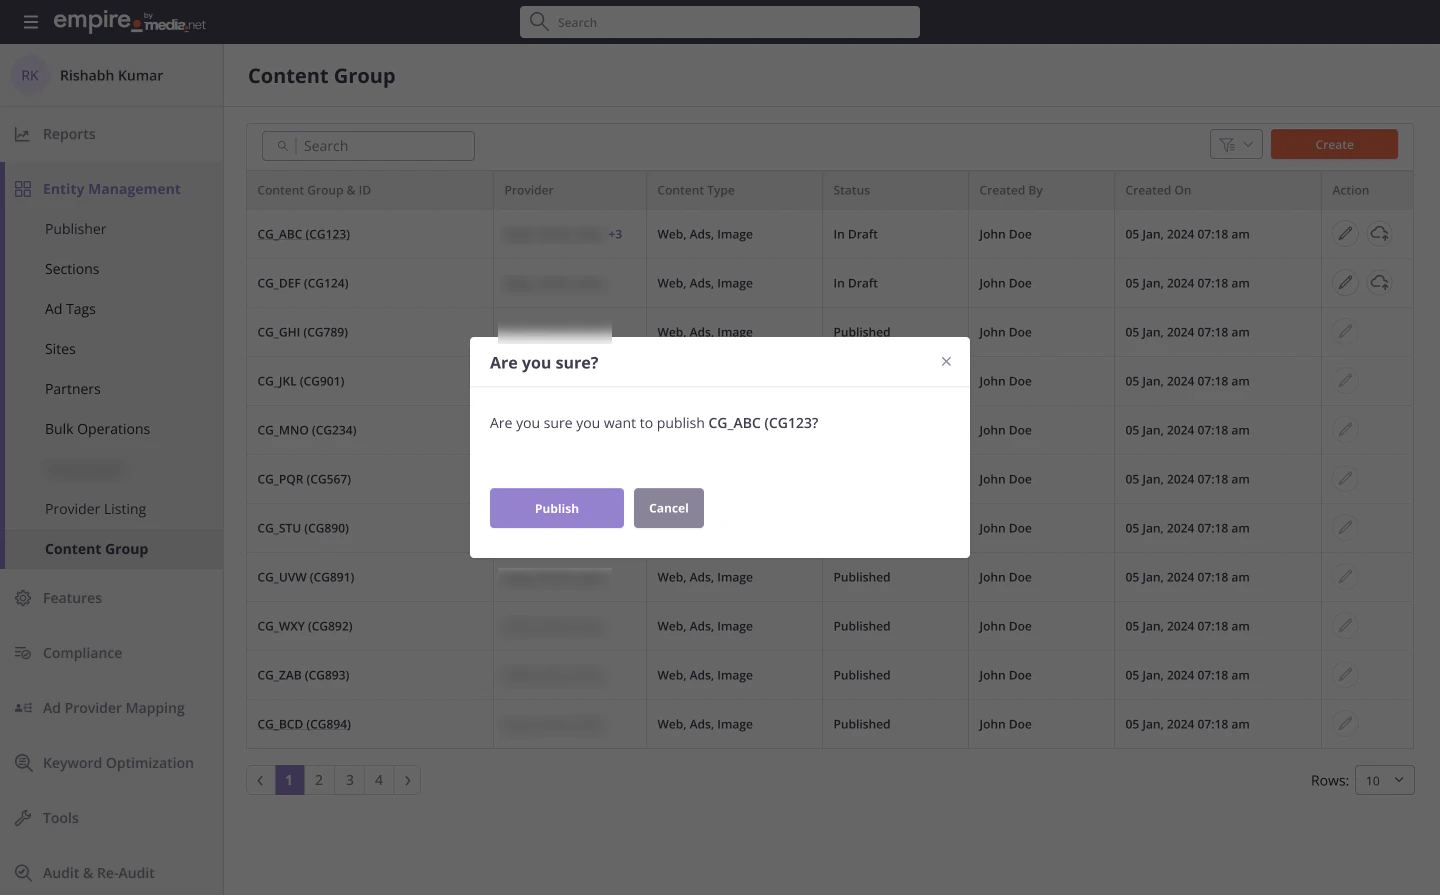
Anyone can create a content group, but only admins can publish one so others can use it in their flowcharts. Admins get a publish button, a confirmation and a message once it is live. Everyone else sees the status, so they know whether a group is ready to use.
Assemblies
The builder
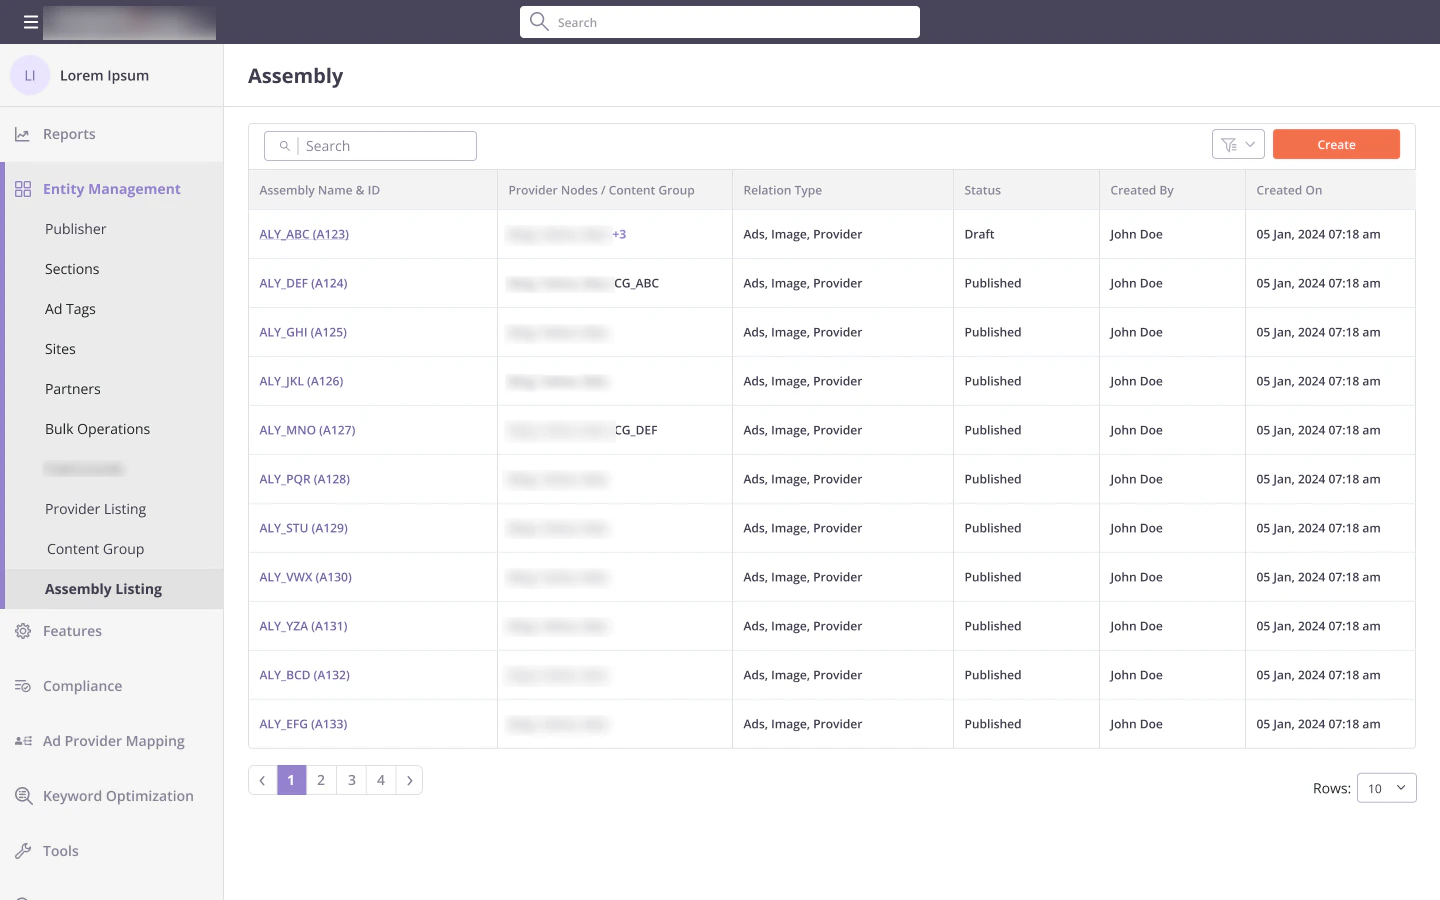
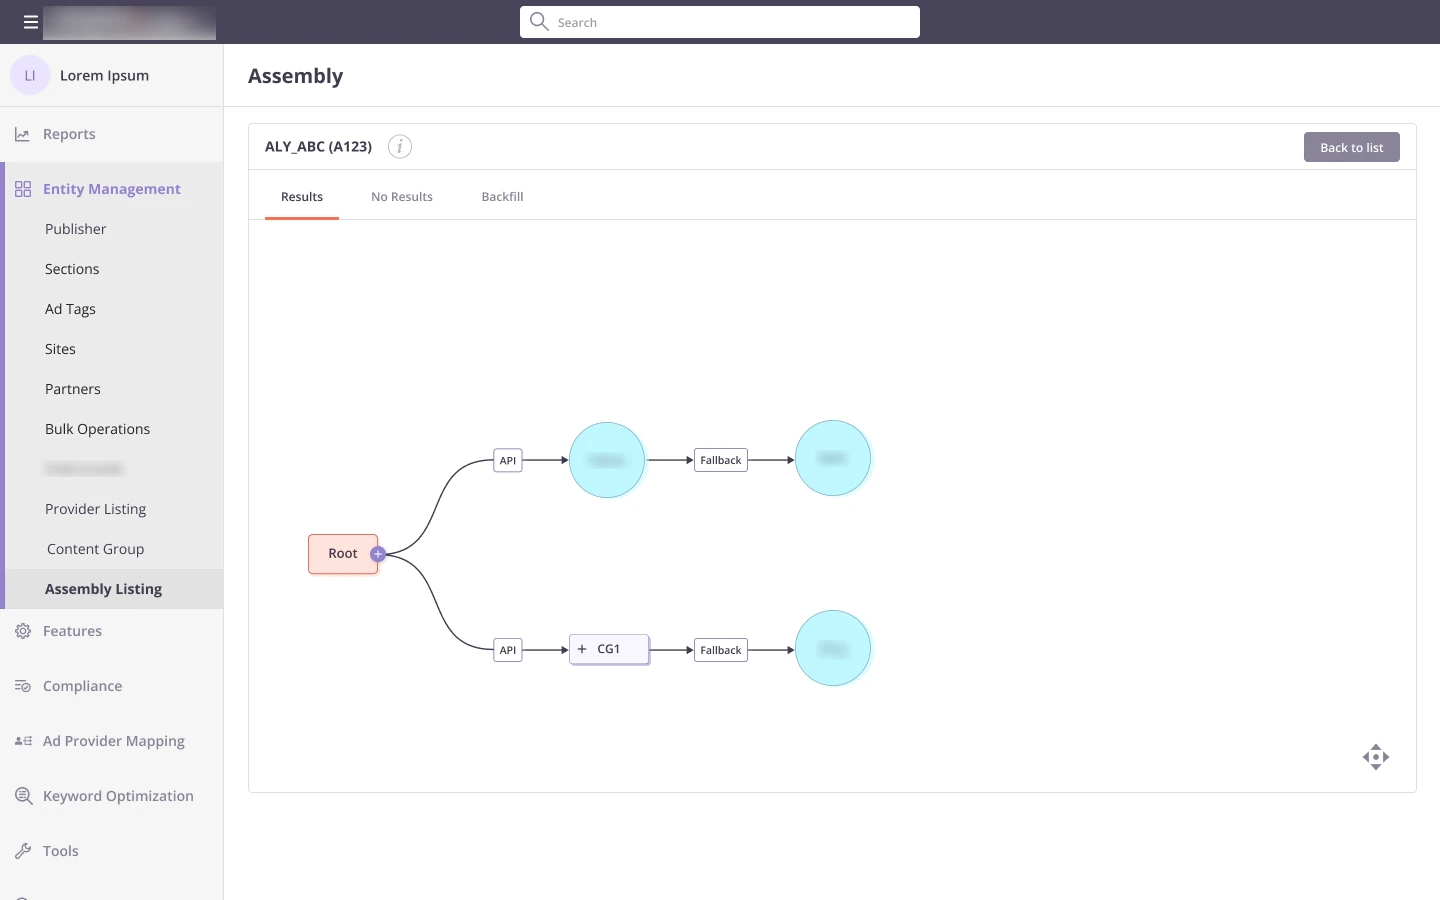
An assembly is the full recipe for one results page. The list shows each one with the providers and content groups it uses, and opens straight into its flowchart. Every assembly has three parts as tabs: Results, which is required, plus No Results (what to show when nothing comes back) and Backfill (how to fill empty spots), which are optional.
One step at a time
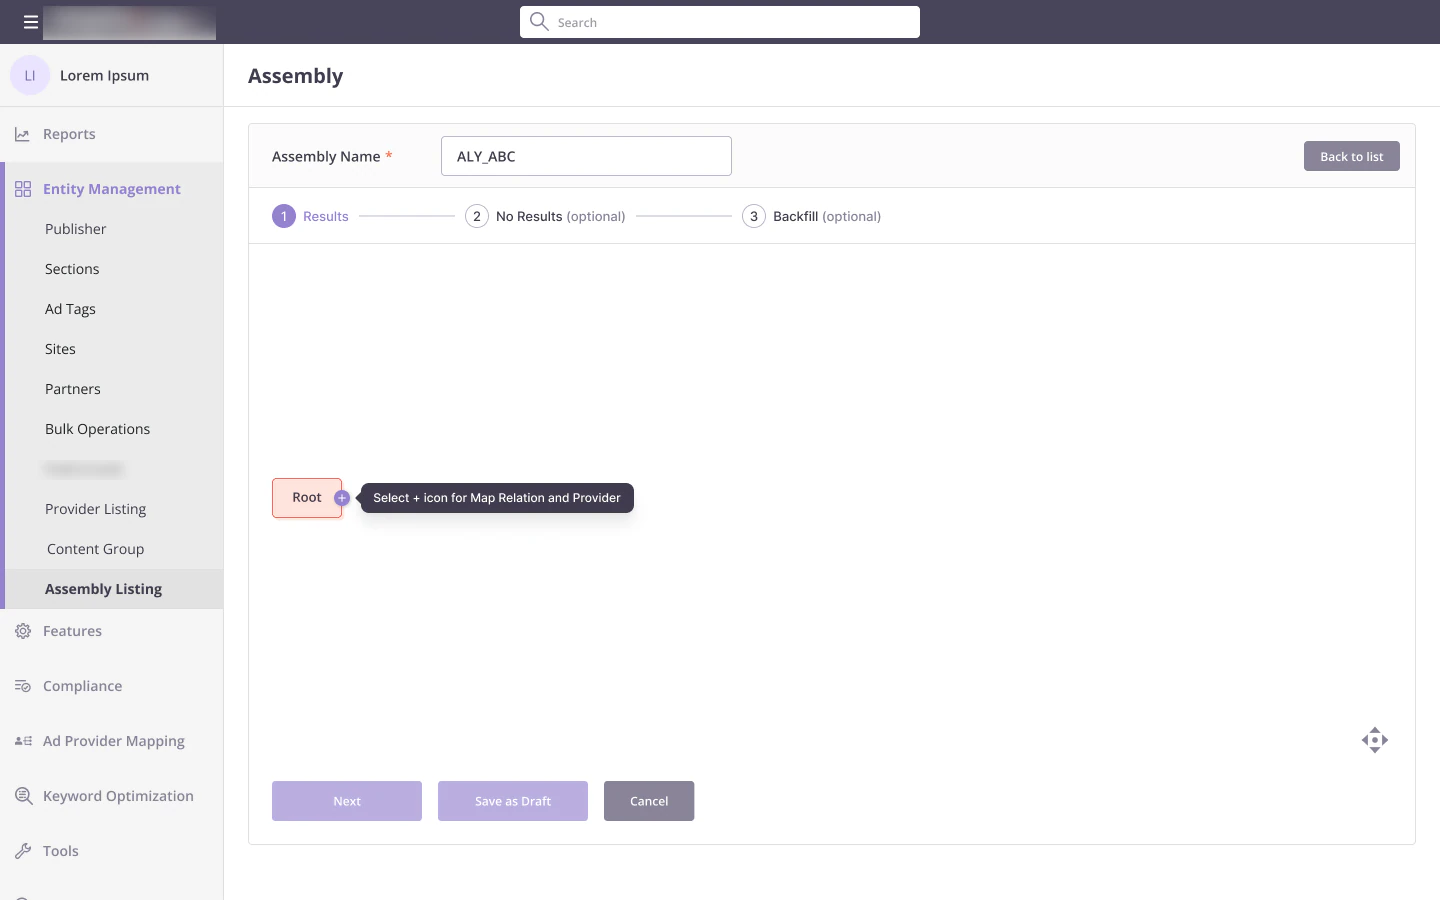
Creating an assembly is a three-step flow. The first step is placed for you with a hint: "Select + icon for Map Relation and Provider". From there, only a direct ask or a percent split is offered, so your first choice is always a valid one. Save as Draft keeps your progress for later.
Splitting visitors
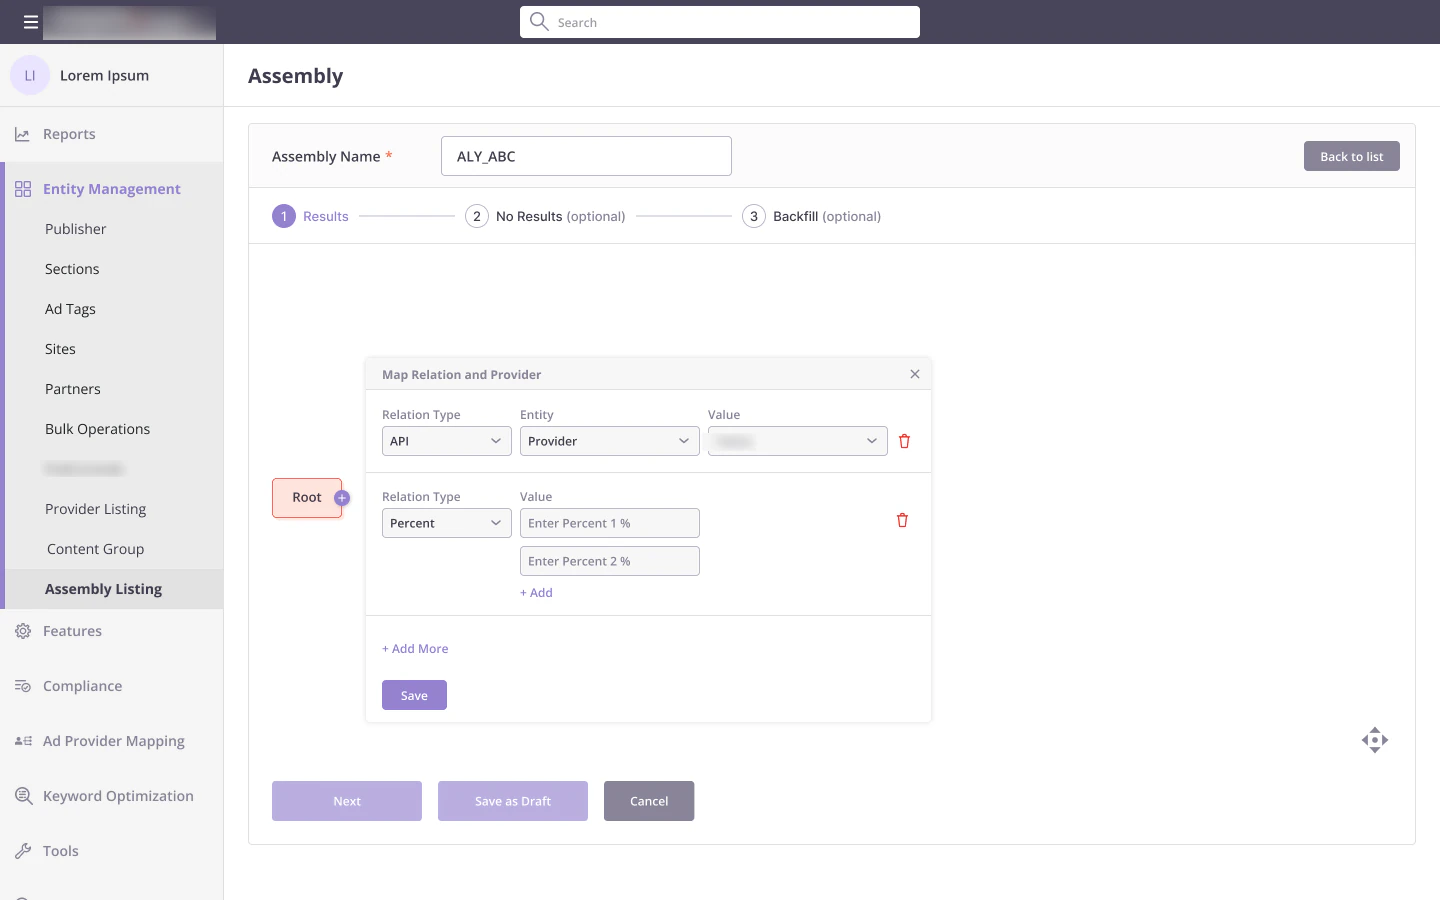
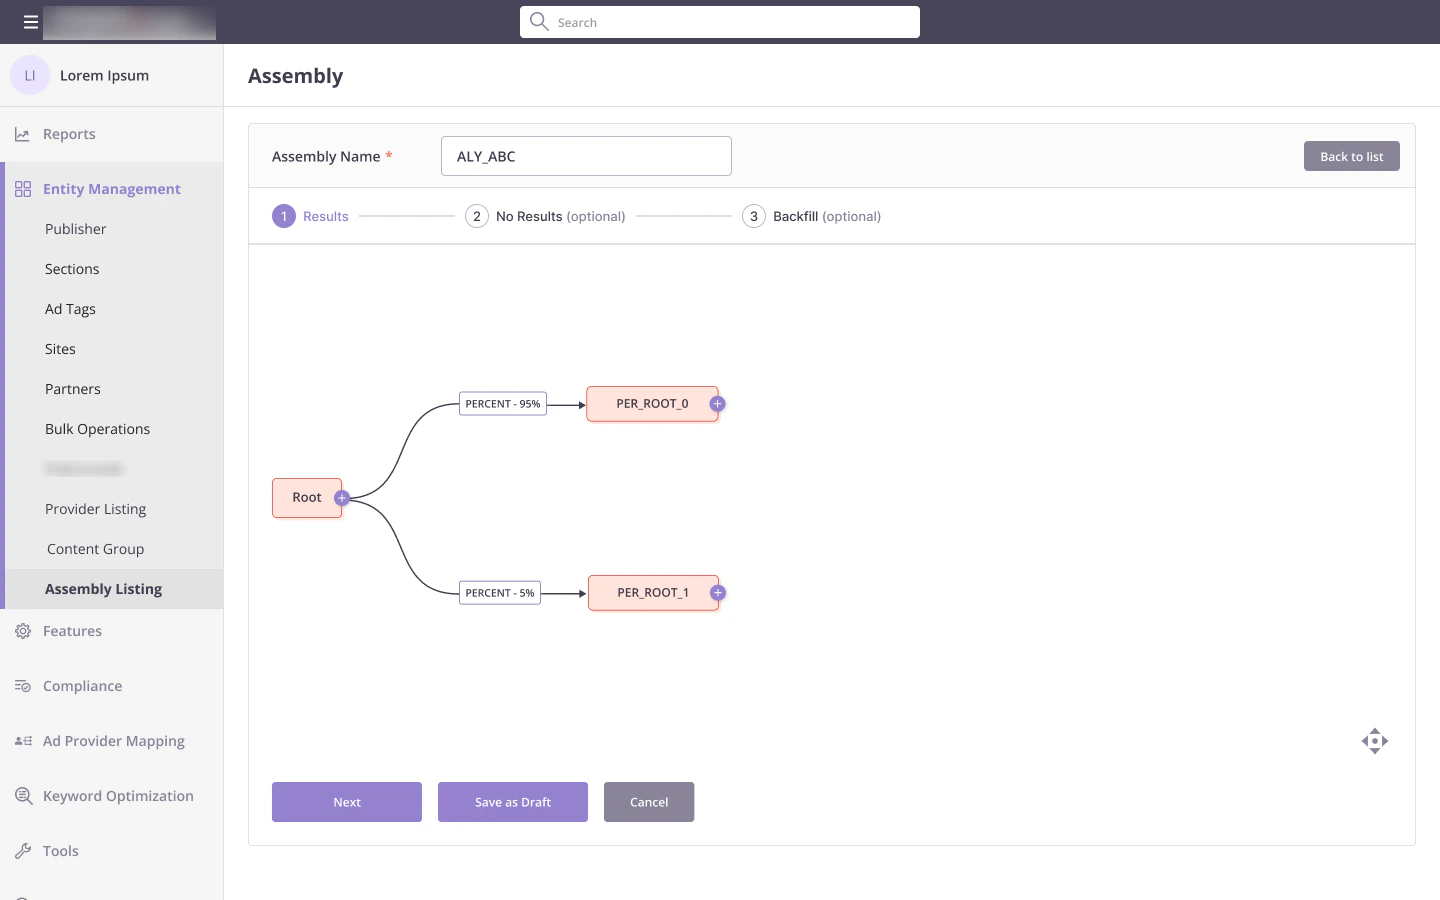
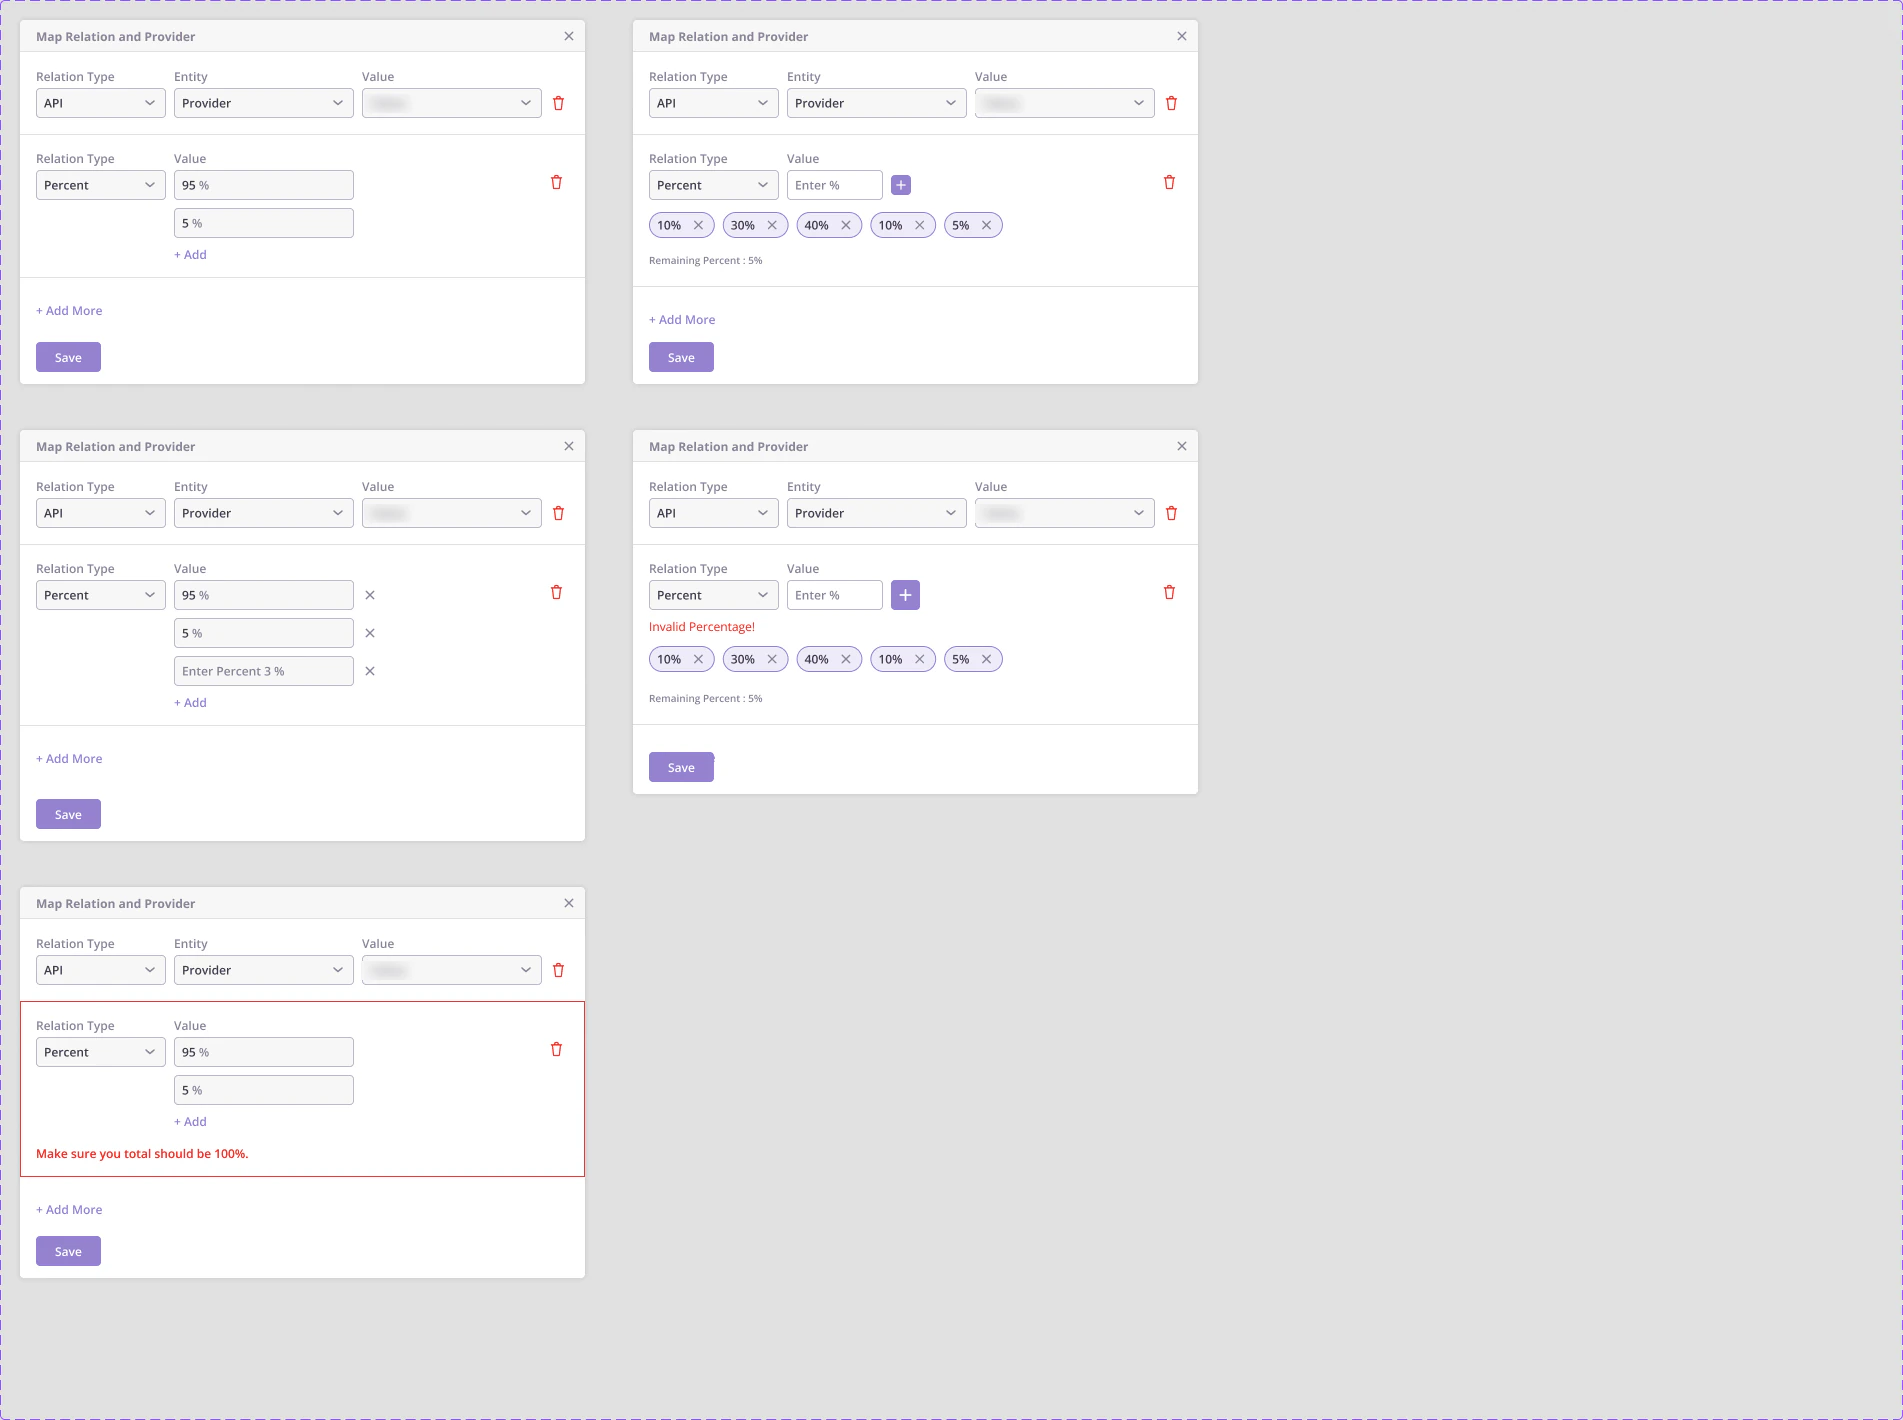
A Percent arrow splits visitors between branches, for example 95% to the usual setup and 5% to a test. The form adds a value per branch, shows what is left as you go, and stops you if the total is not 100. Each branch can then grow on its own.
Backups, and groups inside groups
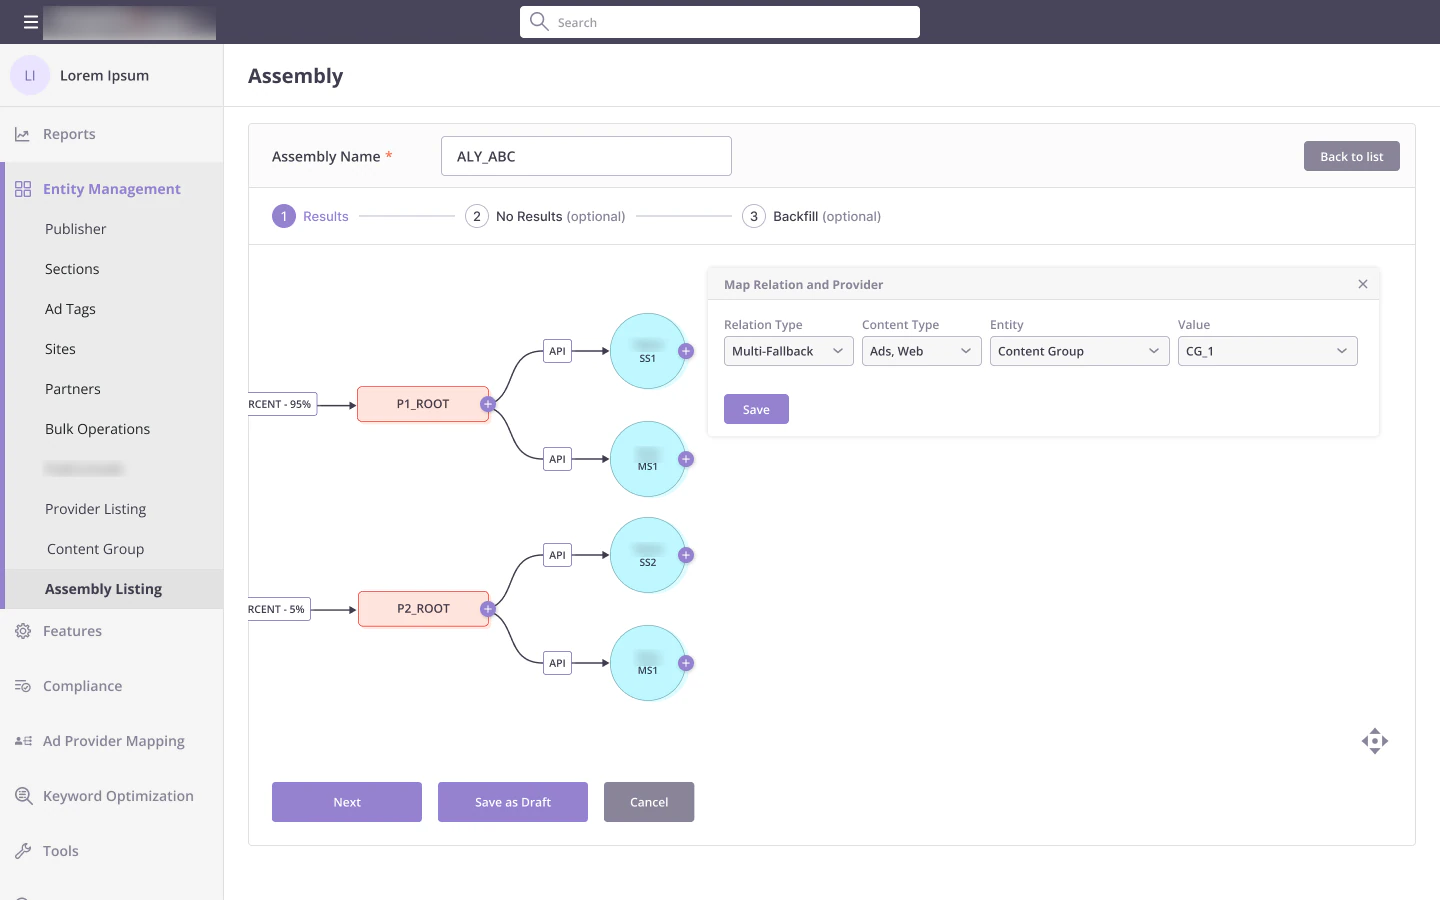
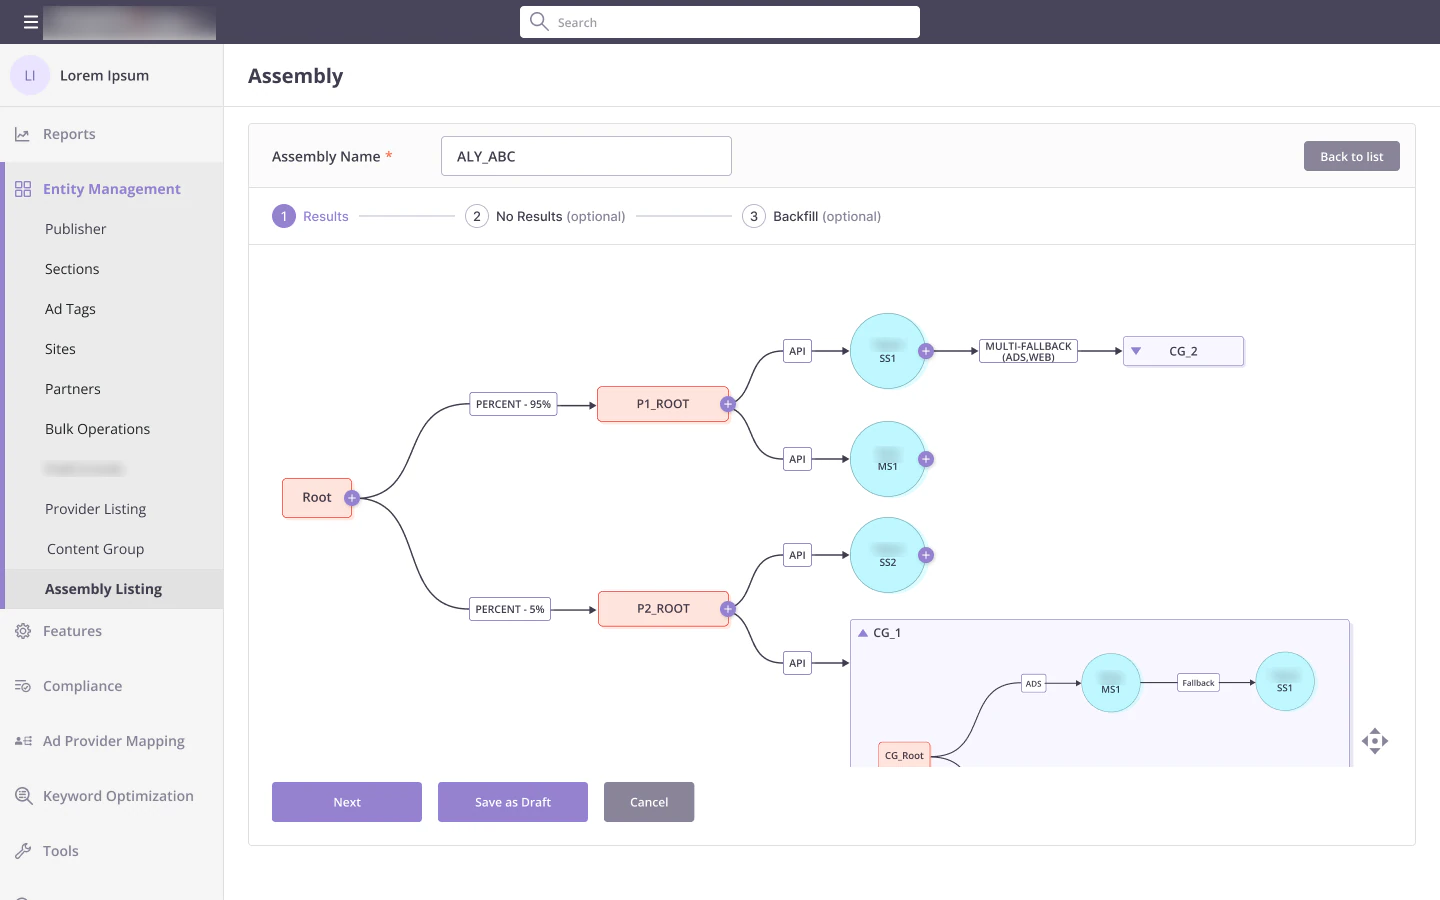
A multi-fallback lets a provider hand over to a whole content group when it has nothing for certain kinds of content. A content group shows up as a single step that expands in place, so you can see what is inside without leaving the flowchart.
Decisions and conditions
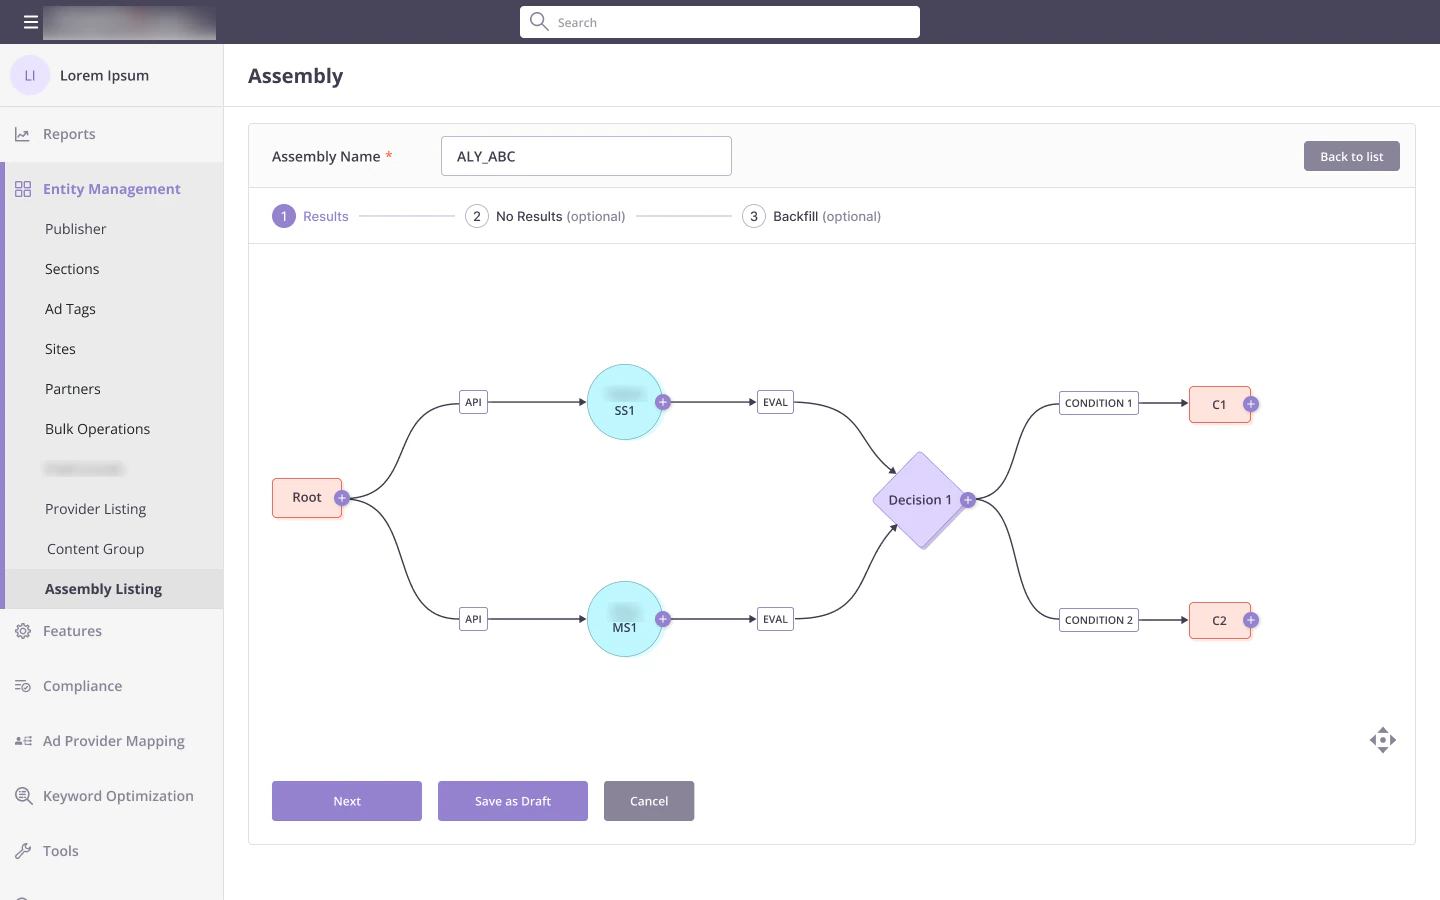
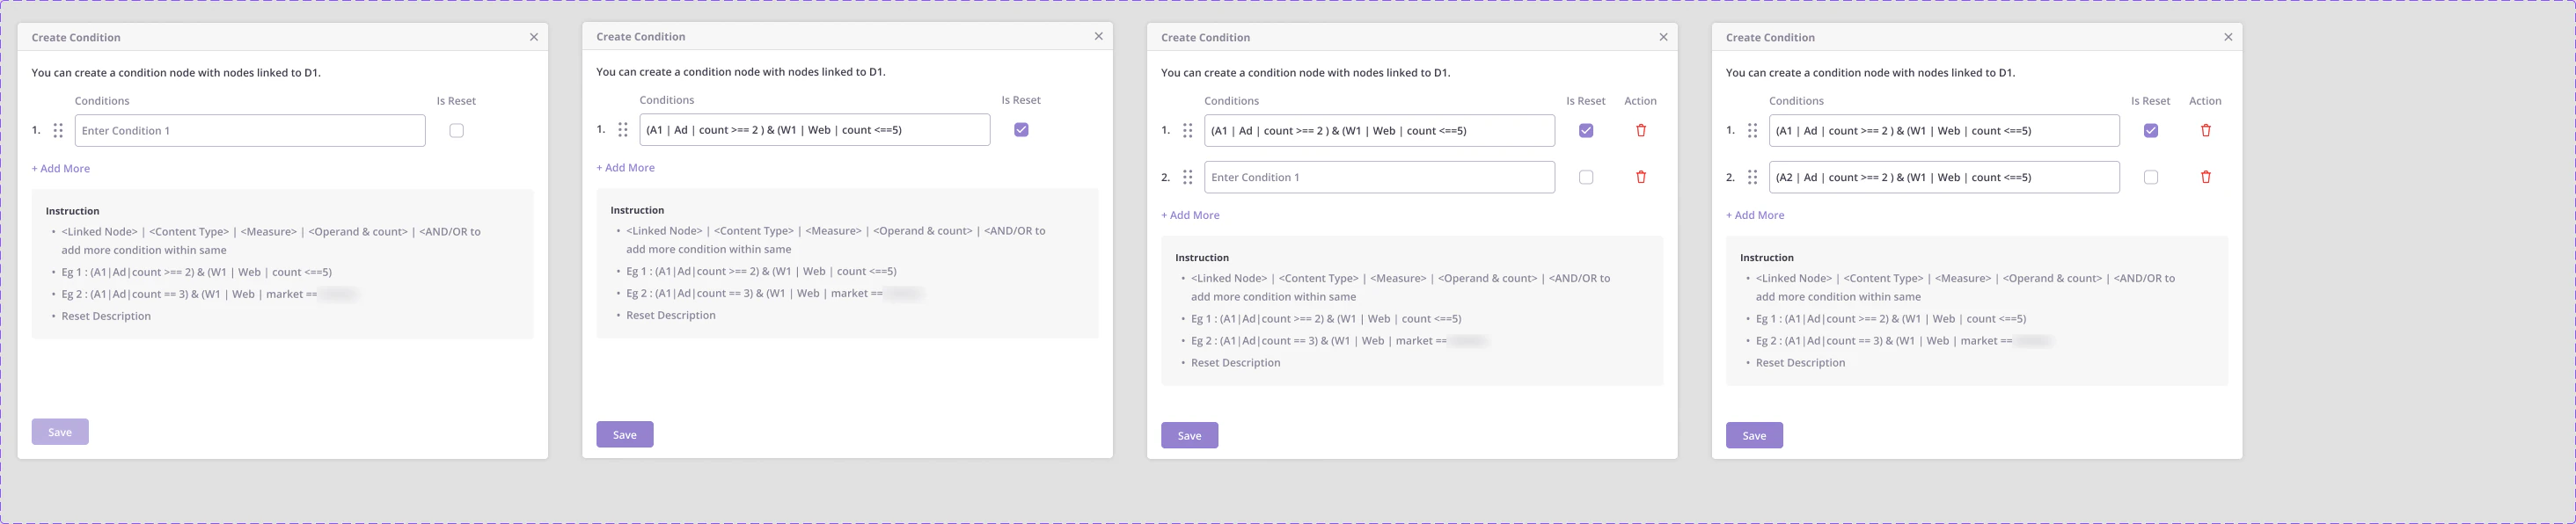
Eval sends results from several providers into a decision step that compares them. After a decision, only conditions can follow, each written in a short syntax with the instructions right below the field. Conditions can be reordered and marked as reset.
Strategies
Putting behaviour on top of the flowchart
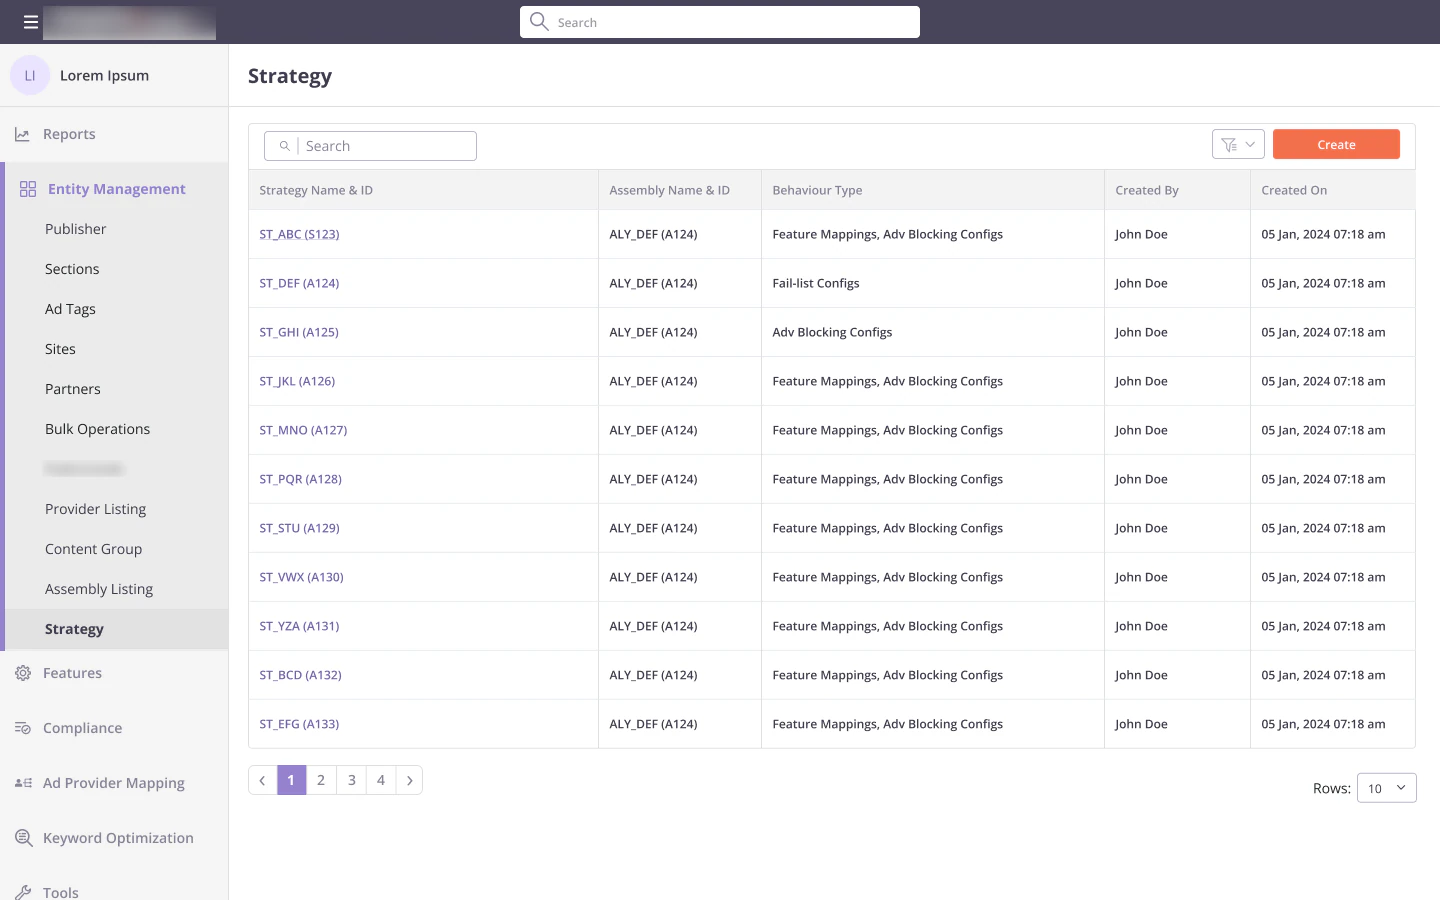
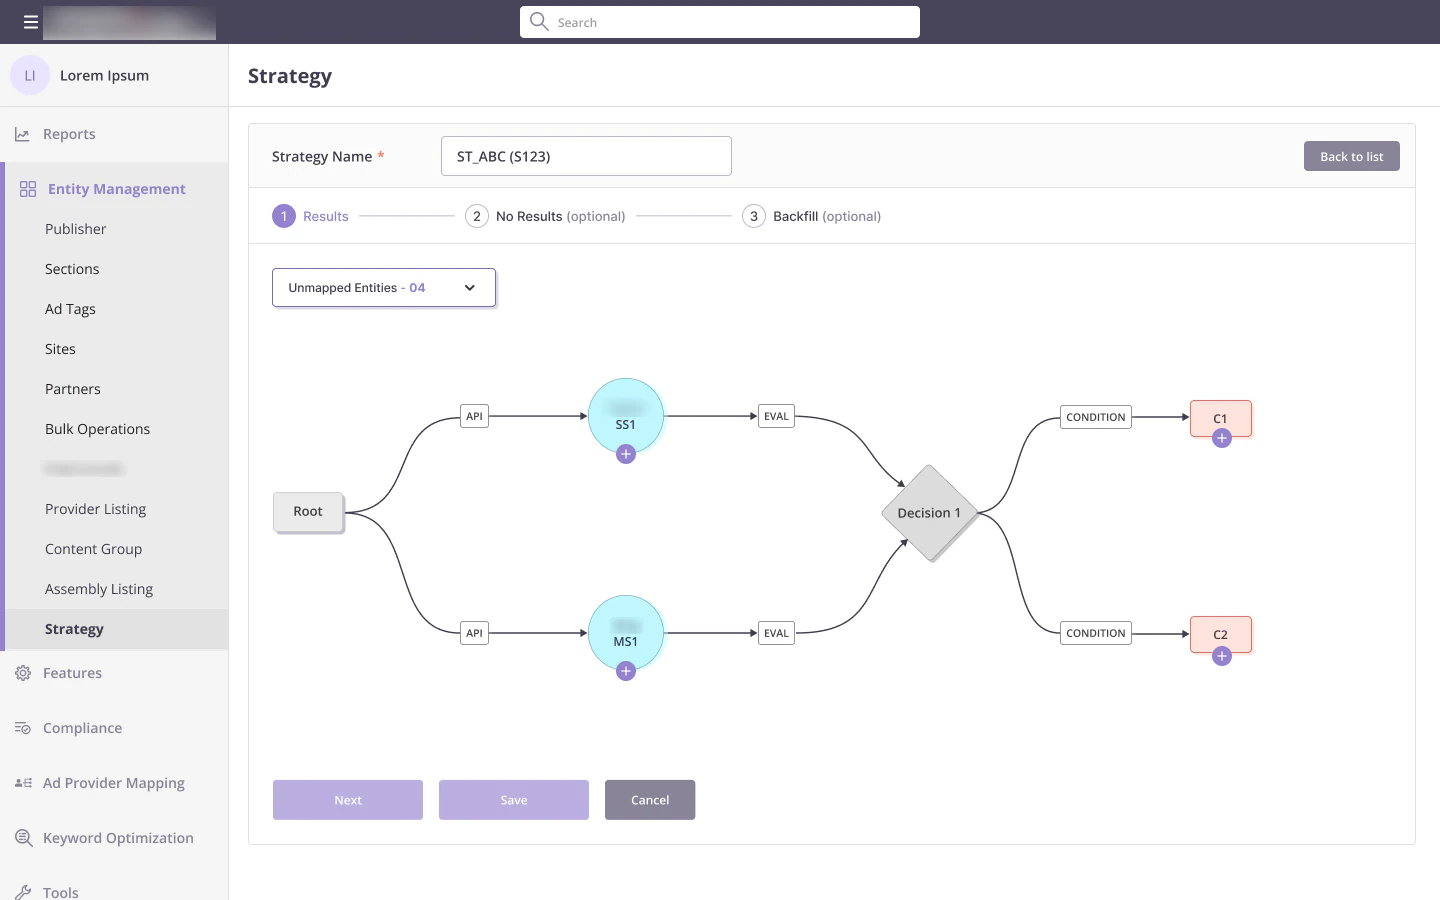
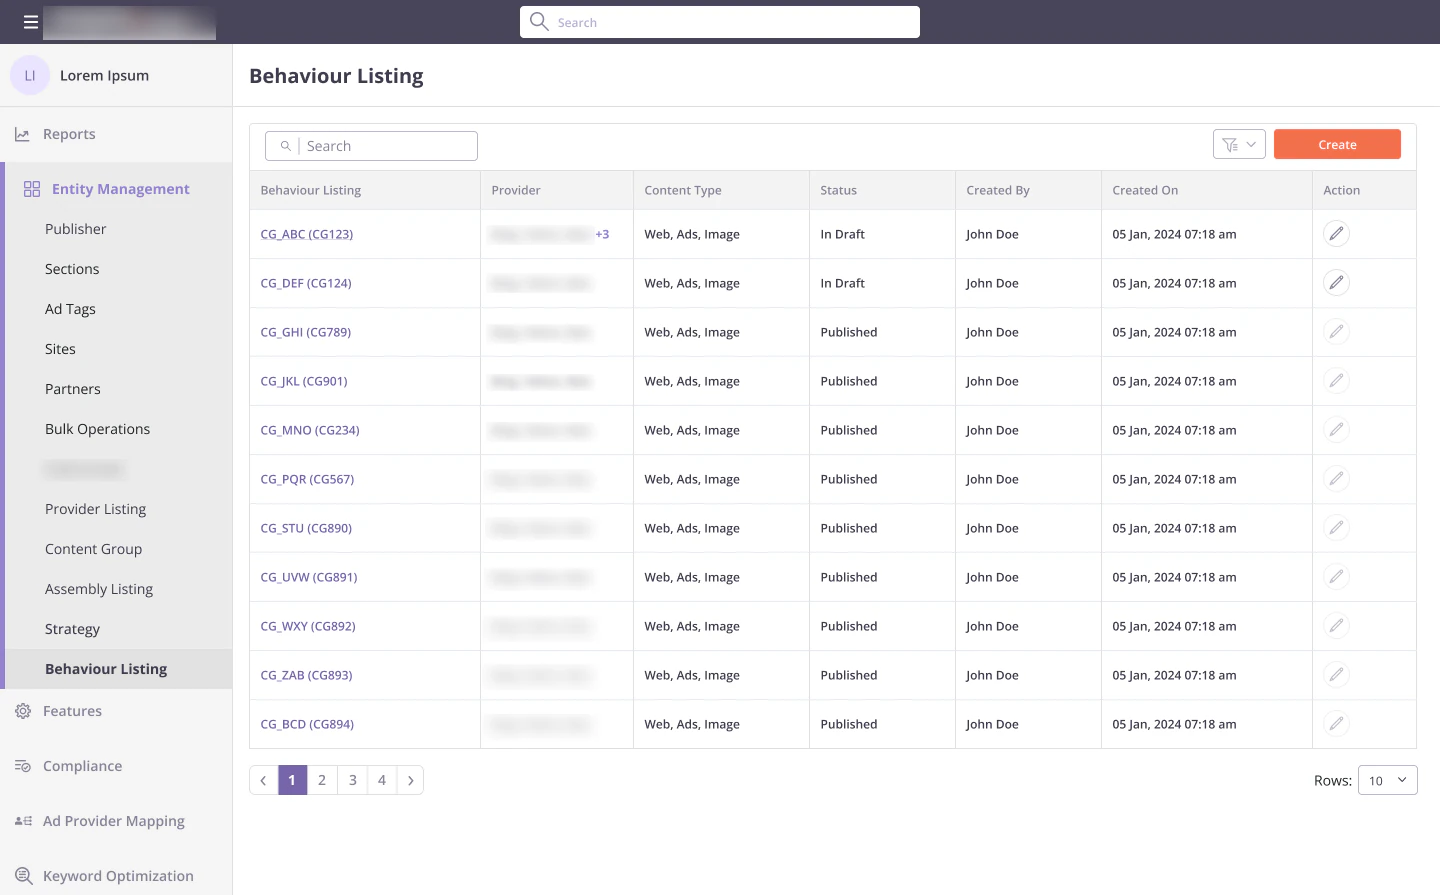
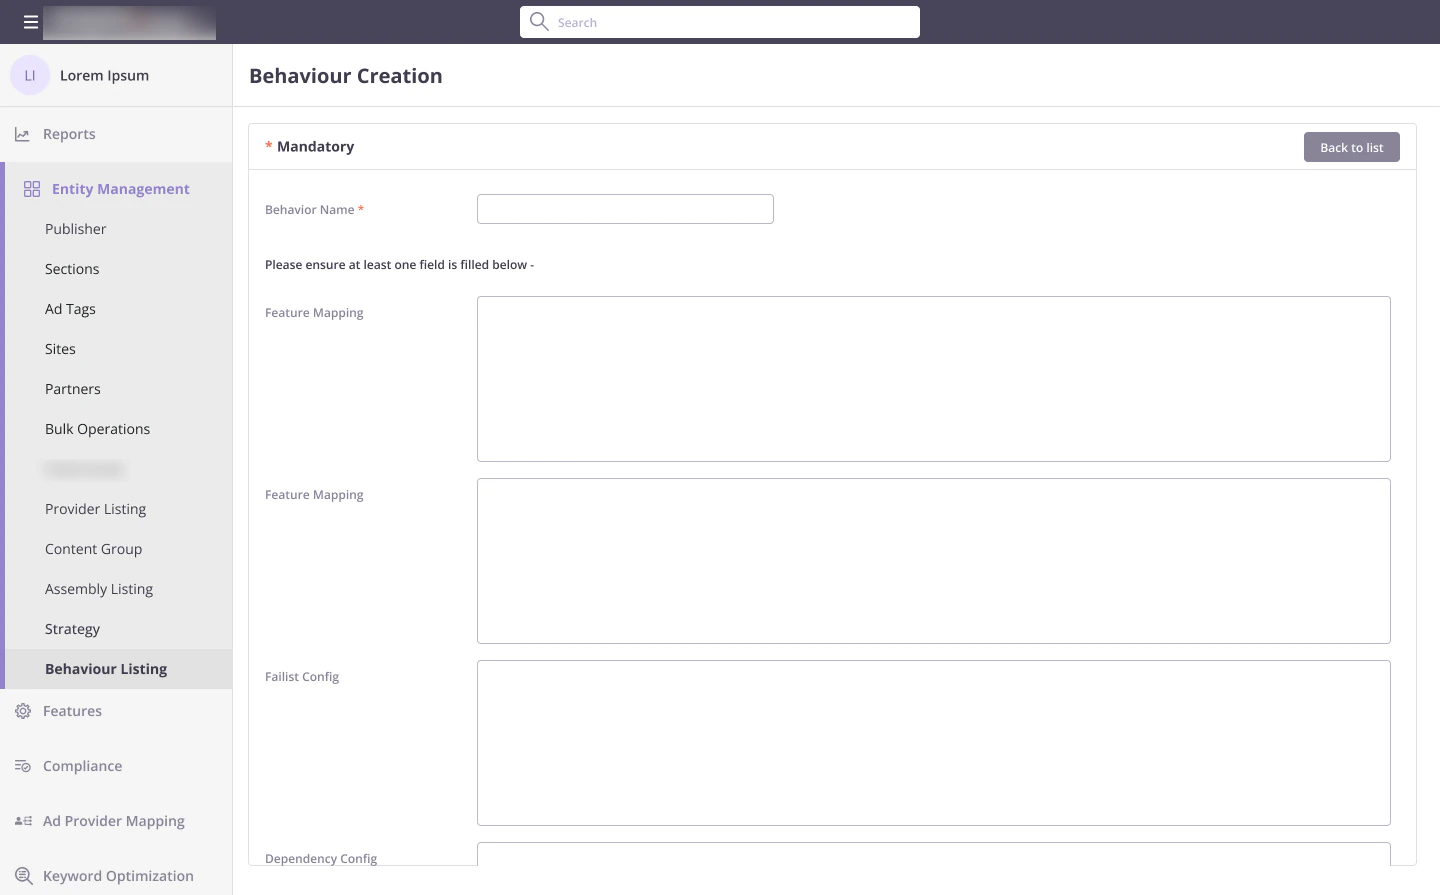
Later I added Strategies and Behaviours to OSCAR. A behaviour is a bundle of settings, such as which features are switched on, what to skip when something fails, and what depends on what. A strategy takes an assembly and attaches behaviours to its steps.
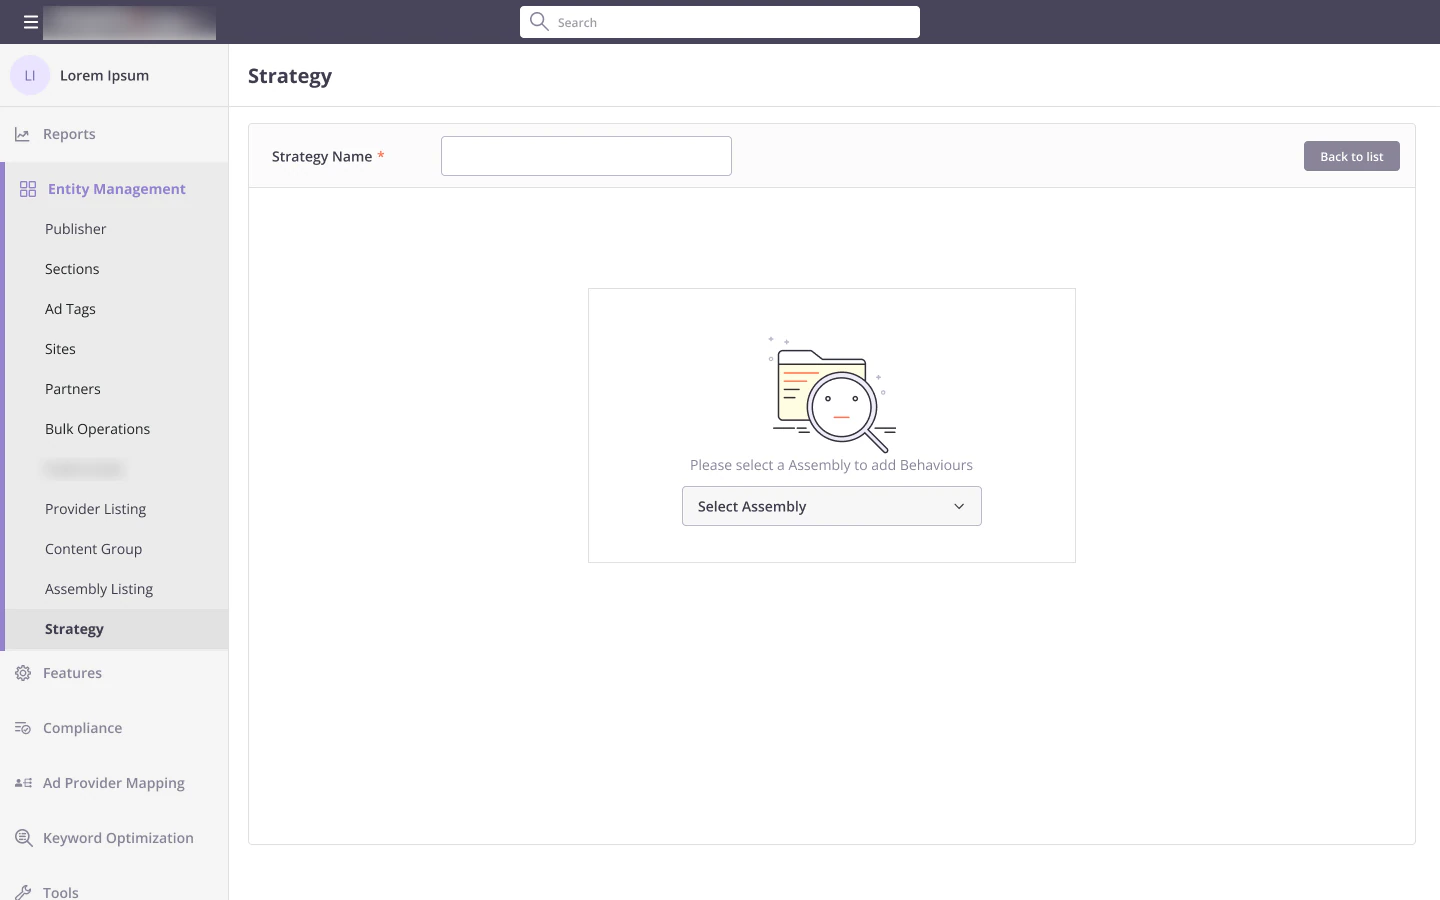
Nothing left unmapped
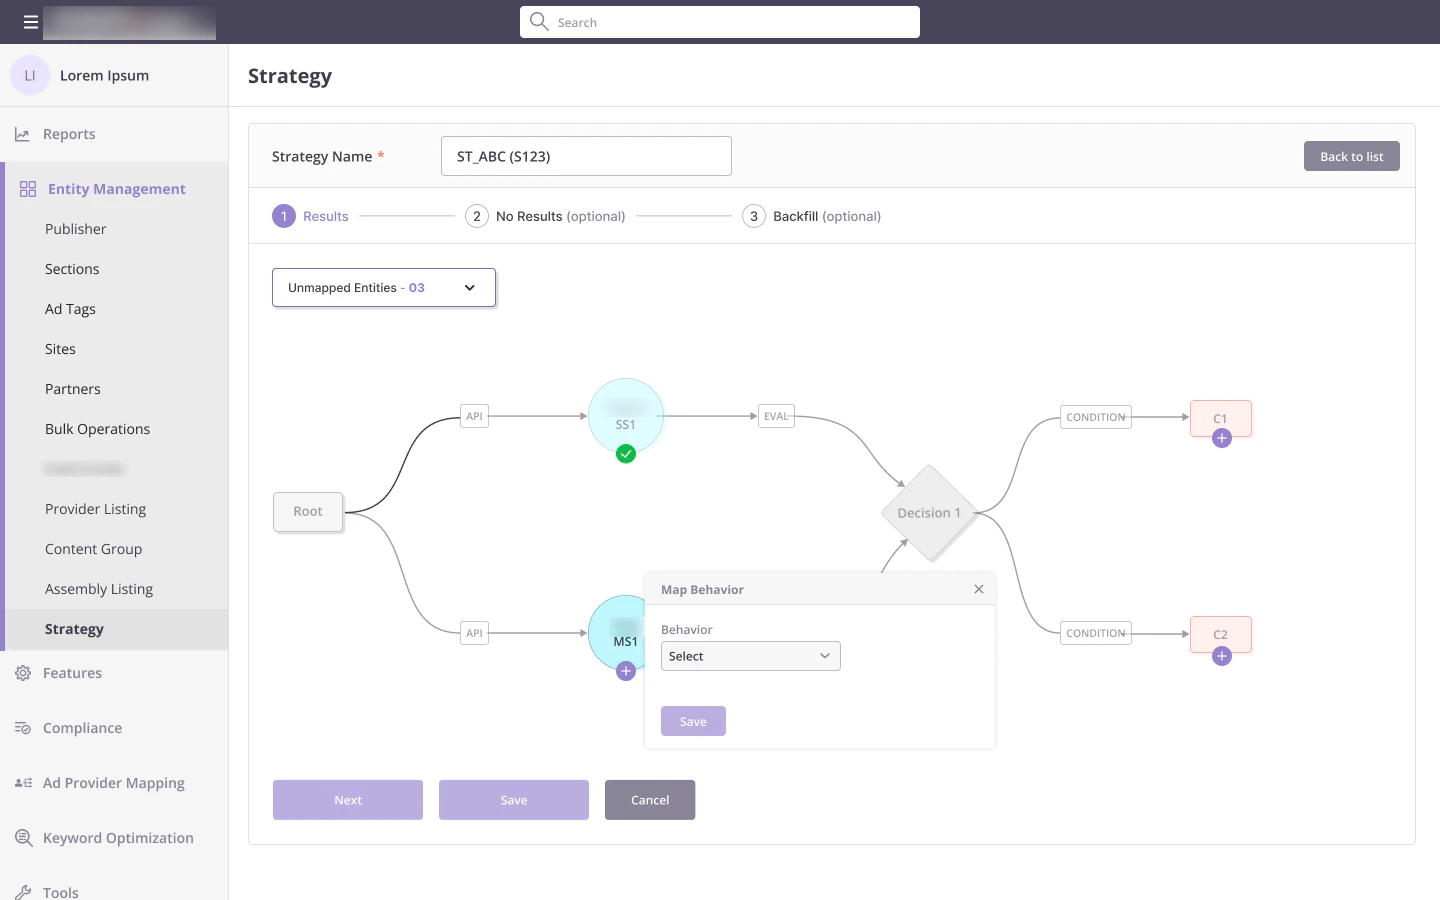
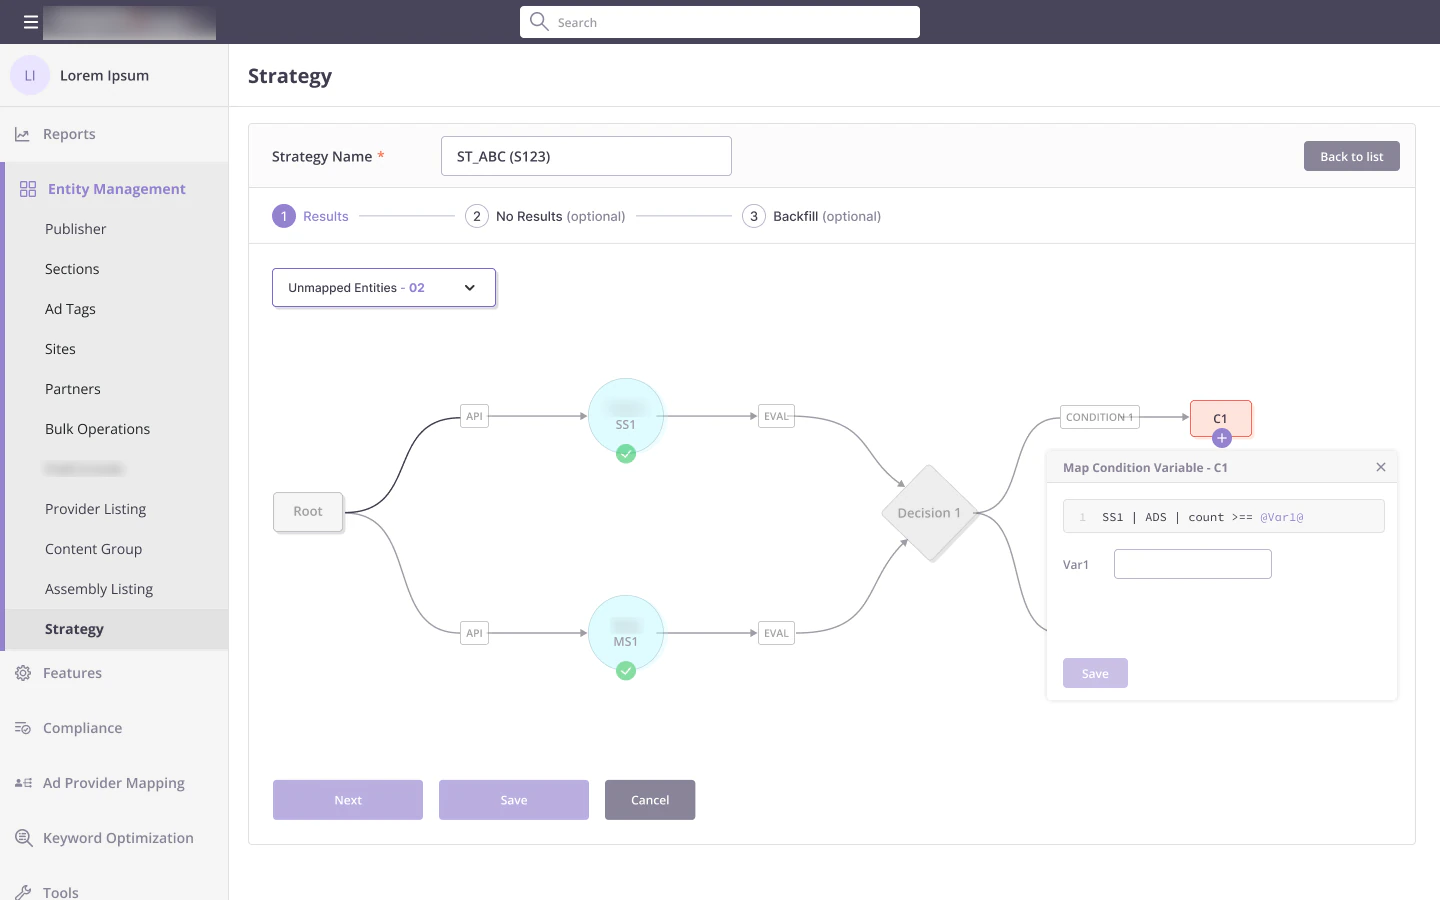
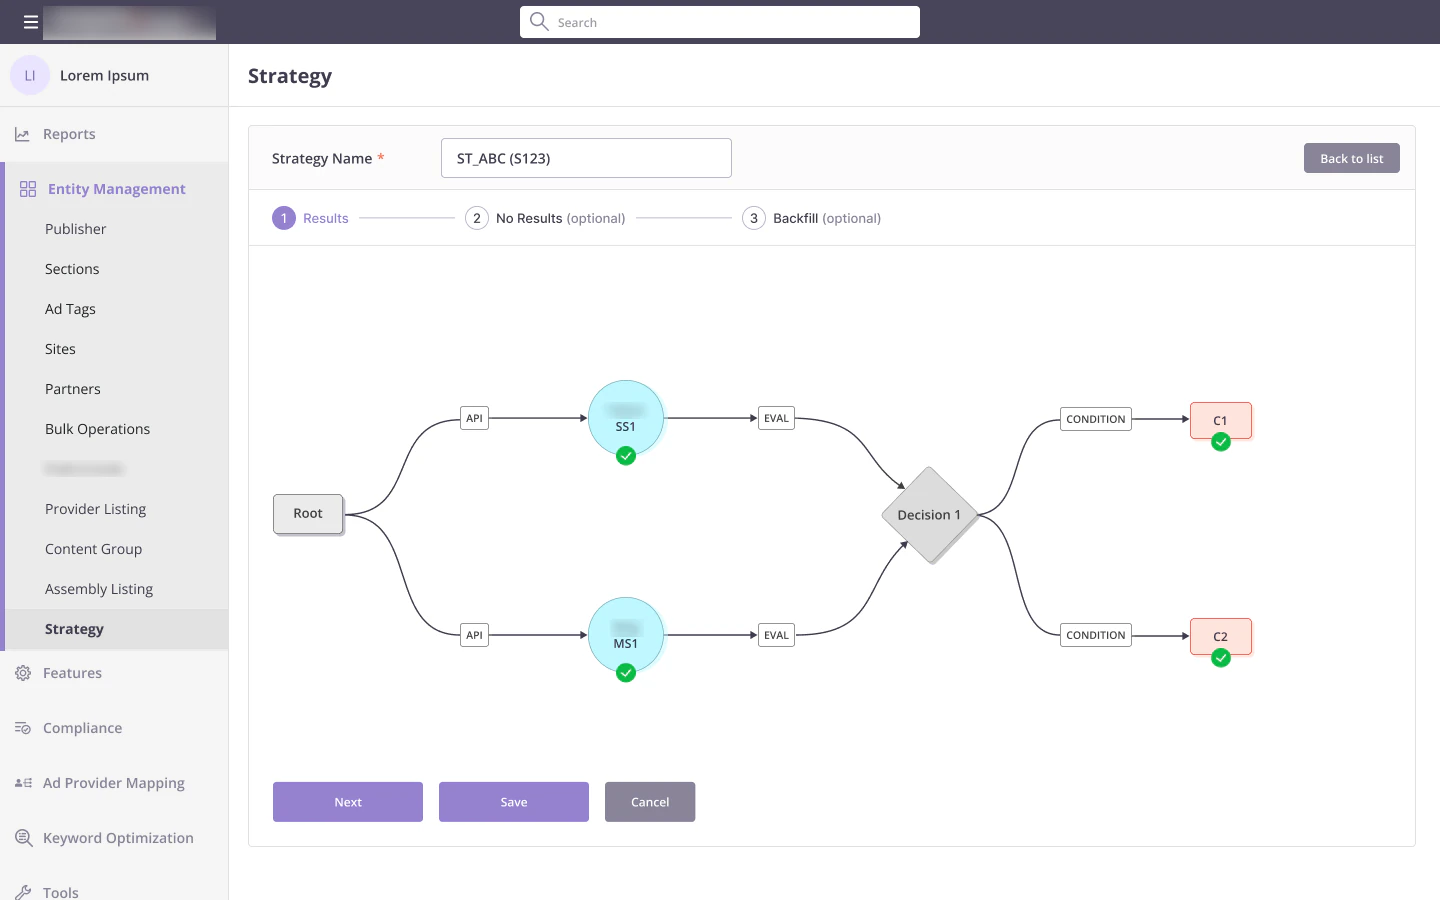
Choosing an assembly draws its flowchart. An Unmapped Entities counter at the top counts down as steps get a behaviour, and each finished step gets a green check, so it is obvious what is left. Condition steps ask for their values in place.
What I learned
Designing for a rulebook
The rules about which arrow can follow which step were the hardest part of the product. Building them into the menus did more than any help text could.
Showing the flowchart the way the engine reads it gave product, engineering and operations one shared picture to talk about.
Content groups as single steps that expand kept big flowcharts easy to read.